Payne County, Oklahoma Nativity & Citizenship Status (2024)
Place of birth and citizenship status analysis for Payne County, Oklahoma
Payne County, Oklahoma Nativity & Citizenship Indicators (2024)
Native Born
93.7%
Foreign Born
6.3%
Naturalized
1.6%
US Citizens
95.3%
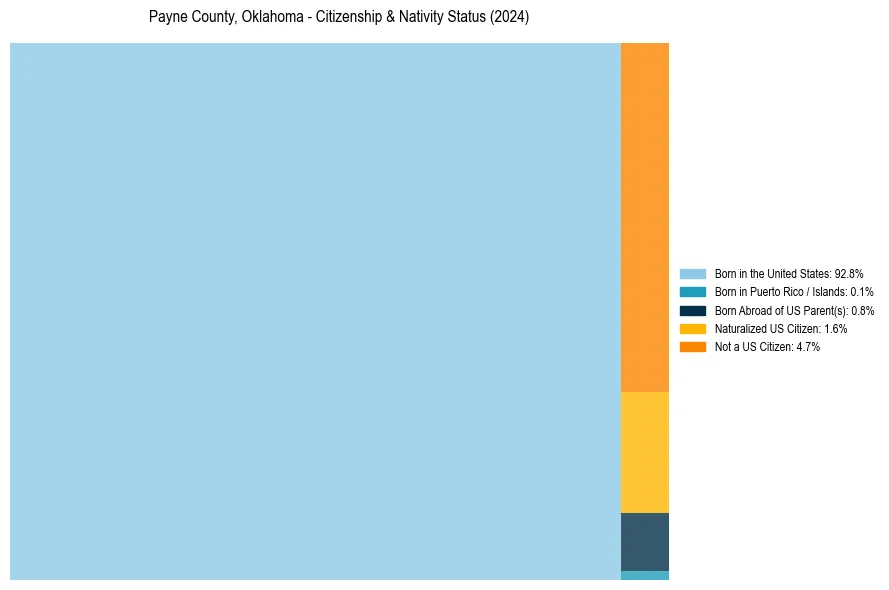
Payne County, Oklahoma Nativity & Citizenship Distribution
Payne County, Oklahoma Historical Nativity Trends (2010–2024)
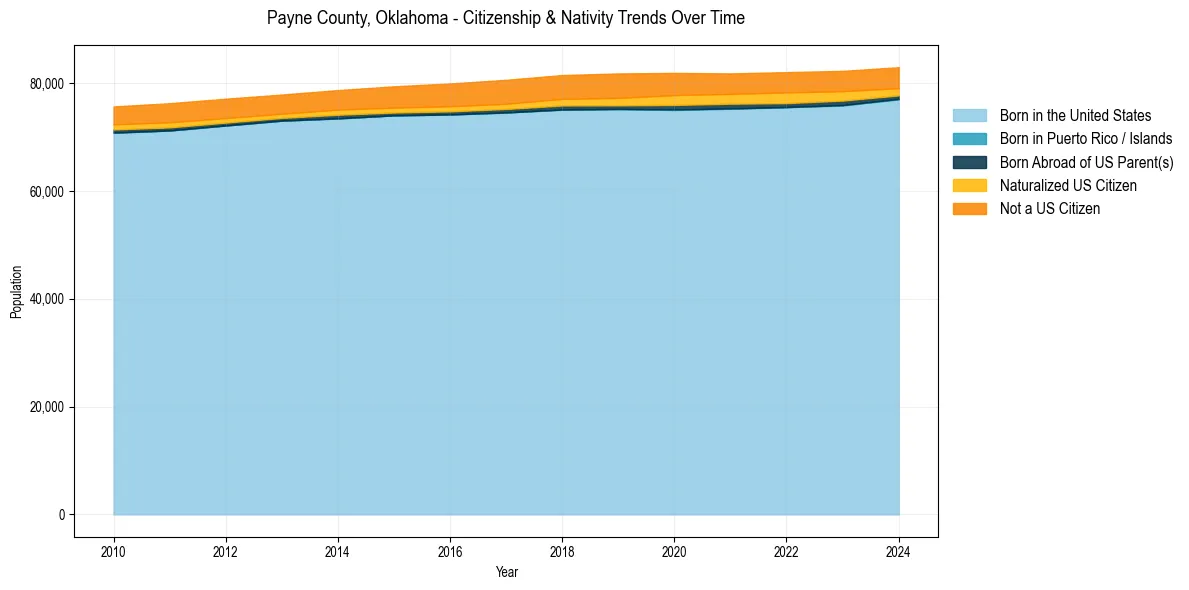
Payne County, Oklahoma Population & Nativity History
| Year | Total Pop | Foreign Born | Native Born |
|---|---|---|---|
| 2024 | 82,972 | 6.3% | 93.7% |
| 2023 | 82,290 | 6.7% | 93.3% |
| 2022 | 82,058 | 7.0% | 93.0% |
| 2021 | 81,817 | 6.9% | 93.1% |
| 2020 | 81,912 | 7.3% | 92.7% |
| 2019 | 81,815 | 7.2% | 92.8% |
| 2018 | 81,512 | 6.9% | 93.1% |
| 2017 | 80,634 | 6.7% | 93.3% |
| 2016 | 79,953 | 6.5% | 93.5% |
| 2015 | 79,423 | 6.1% | 93.9% |
| 2014 | 78,723 | 5.8% | 94.2% |
| 2013 | 77,897 | 5.6% | 94.4% |
| 2012 | 77,125 | 5.8% | 94.2% |
| 2011 | 76,291 | 5.9% | 94.1% |
| 2010 | 75,687 | 5.6% | 94.4% |
Nativity & Citizenship FAQs for Payne County, Oklahoma
Approximately 6.3% of residents in Payne County, Oklahoma were born outside the United States.
The vast majority of residents, roughly 95.3%, are U.S. citizens (including both native-born and naturalized citizens).