Oklahoma County, Oklahoma Nativity & Citizenship Status (2024)
Place of birth and citizenship status analysis for Oklahoma County, Oklahoma
Oklahoma County, Oklahoma Nativity & Citizenship Indicators (2024)
Native Born
89.2%
Foreign Born
10.8%
Naturalized
4.2%
US Citizens
93.4%
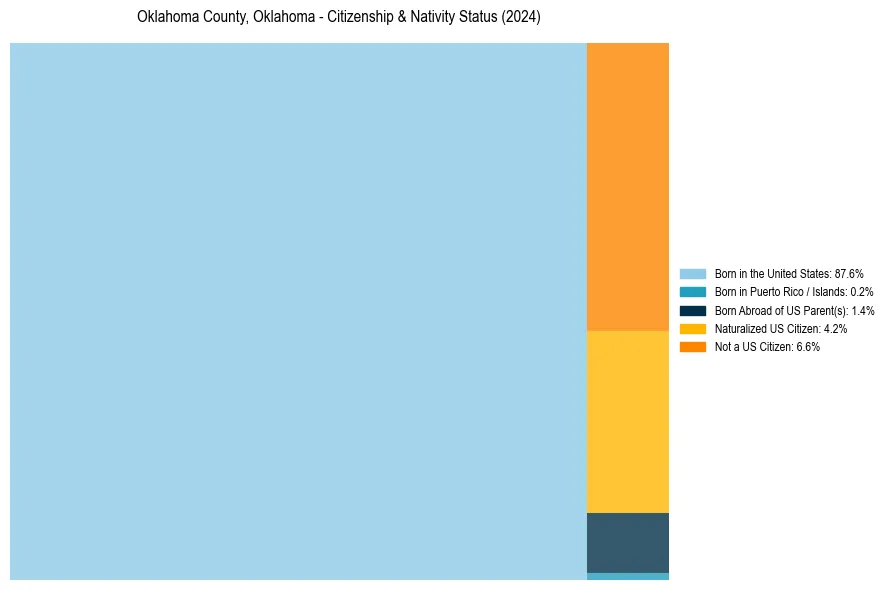
Oklahoma County, Oklahoma Nativity & Citizenship Distribution
Oklahoma County, Oklahoma Historical Nativity Trends (2010–2024)
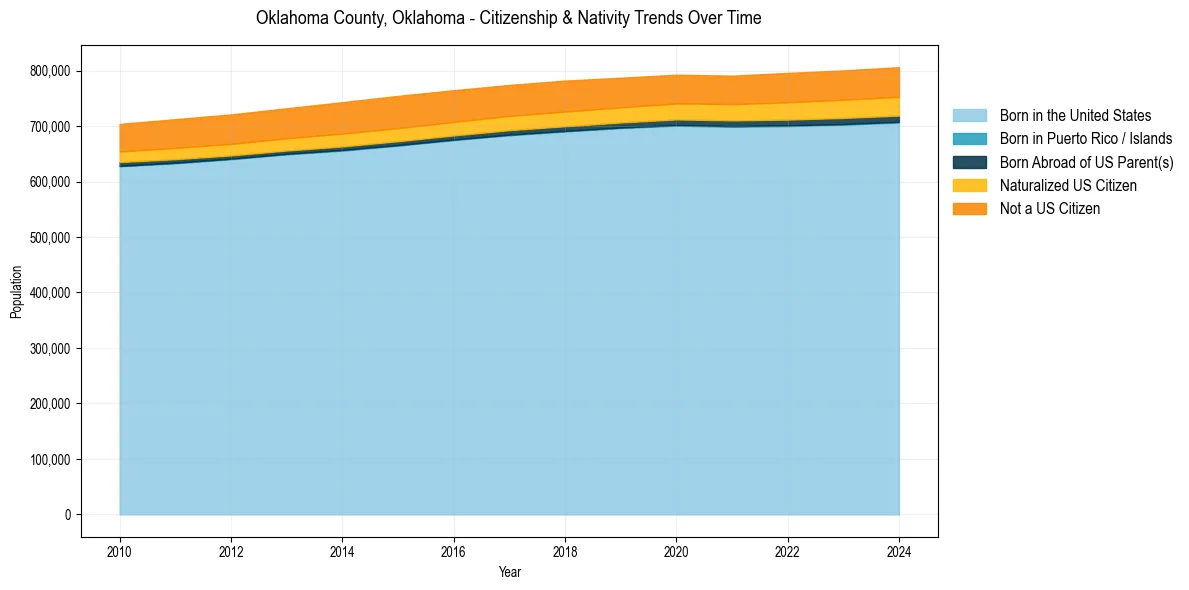
Oklahoma County, Oklahoma Population & Nativity History
| Year | Total Pop | Foreign Born | Native Born |
|---|---|---|---|
| 2024 | 806,199 | 10.8% | 89.2% |
| 2023 | 800,487 | 10.7% | 89.3% |
| 2022 | 795,822 | 10.6% | 89.4% |
| 2021 | 790,938 | 10.2% | 89.8% |
| 2020 | 792,668 | 10.2% | 89.8% |
| 2019 | 787,216 | 10.3% | 89.7% |
| 2018 | 782,051 | 10.5% | 89.5% |
| 2017 | 774,203 | 10.5% | 89.5% |
| 2016 | 764,698 | 10.7% | 89.3% |
| 2015 | 754,480 | 10.8% | 89.2% |
| 2014 | 743,145 | 10.7% | 89.3% |
| 2013 | 732,118 | 10.4% | 89.6% |
| 2012 | 721,088 | 10.3% | 89.7% |
| 2011 | 712,491 | 10.1% | 89.9% |
| 2010 | 704,023 | 9.8% | 90.2% |
Nativity & Citizenship FAQs for Oklahoma County, Oklahoma
Approximately 10.8% of residents in Oklahoma County, Oklahoma were born outside the United States.
The vast majority of residents, roughly 93.4%, are U.S. citizens (including both native-born and naturalized citizens).