Oklahoma Nativity & Citizenship Status (2024)
Place of birth and citizenship status analysis for Oklahoma
Oklahoma Nativity & Citizenship Indicators (2024)
Native Born
93.6%
Foreign Born
6.4%
Naturalized
2.6%
US Citizens
96.2%
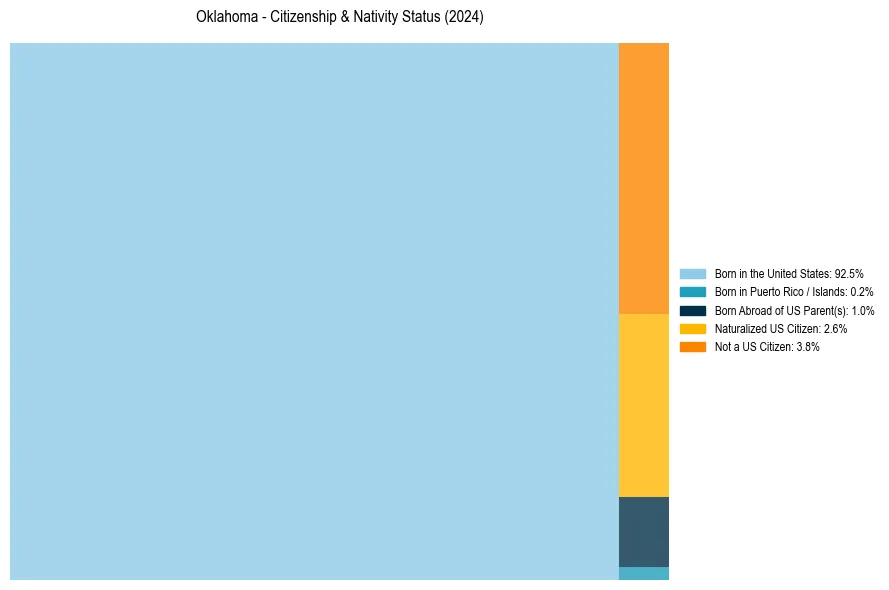
Oklahoma Nativity & Citizenship Distribution
Oklahoma Historical Nativity Trends (2010–2024)
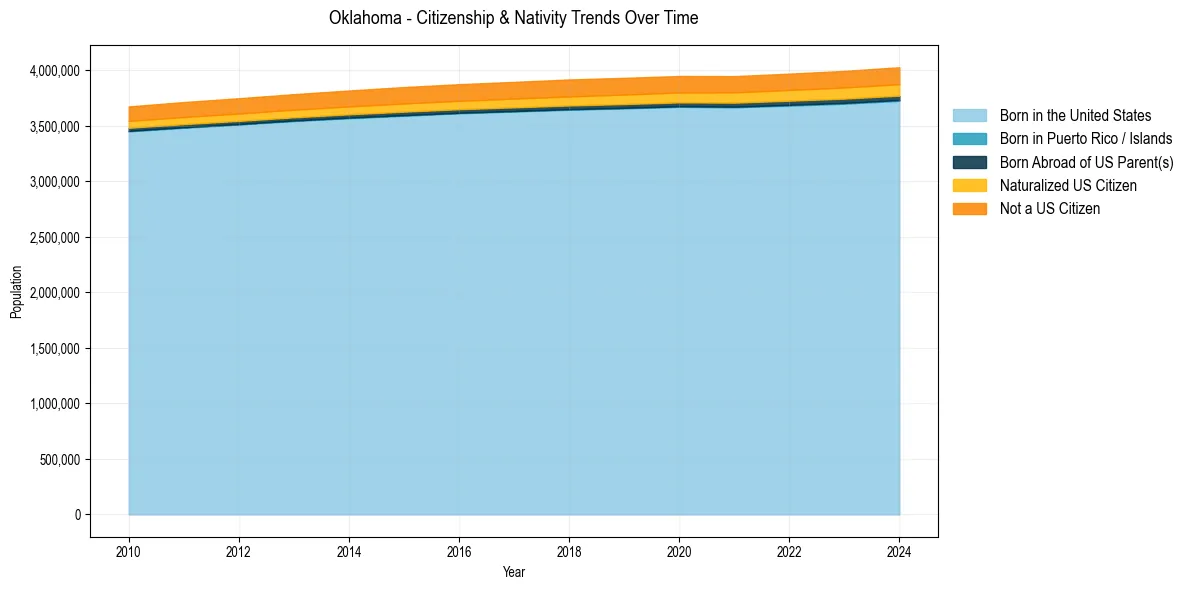
Oklahoma Population & Nativity History
| Year | Total Pop | Foreign Born | Native Born |
|---|---|---|---|
| 2024 | 4,028,634 | 6.4% | 93.6% |
| 2023 | 3,995,260 | 6.3% | 93.7% |
| 2022 | 3,970,497 | 6.1% | 93.9% |
| 2021 | 3,948,136 | 6.1% | 93.9% |
| 2020 | 3,949,342 | 6.0% | 94.0% |
| 2019 | 3,932,870 | 6.0% | 94.0% |
| 2018 | 3,918,137 | 6.0% | 94.0% |
| 2017 | 3,896,251 | 5.9% | 94.1% |
| 2016 | 3,875,589 | 5.8% | 94.2% |
| 2015 | 3,849,733 | 5.8% | 94.2% |
| 2014 | 3,818,851 | 5.6% | 94.4% |
| 2013 | 3,785,742 | 5.5% | 94.5% |
| 2012 | 3,749,005 | 5.5% | 94.5% |
| 2011 | 3,714,520 | 5.4% | 94.6% |
| 2010 | 3,675,339 | 5.2% | 94.8% |
Nativity & Citizenship FAQs for Oklahoma
Approximately 6.4% of residents in Oklahoma were born outside the United States.
The vast majority of residents, roughly 96.2%, are U.S. citizens (including both native-born and naturalized citizens).