Logan County, Oklahoma Nativity & Citizenship Status (2024)
Place of birth and citizenship status analysis for Logan County, Oklahoma
Logan County, Oklahoma Nativity & Citizenship Indicators (2024)
Native Born
96.2%
Foreign Born
3.8%
Naturalized
1.2%
US Citizens
97.4%
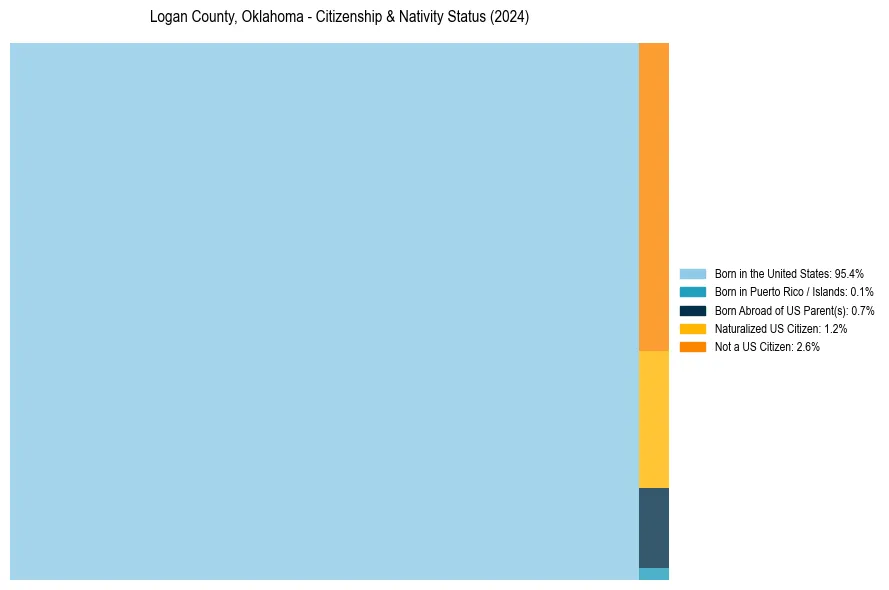
Logan County, Oklahoma Nativity & Citizenship Distribution
Logan County, Oklahoma Historical Nativity Trends (2010–2024)
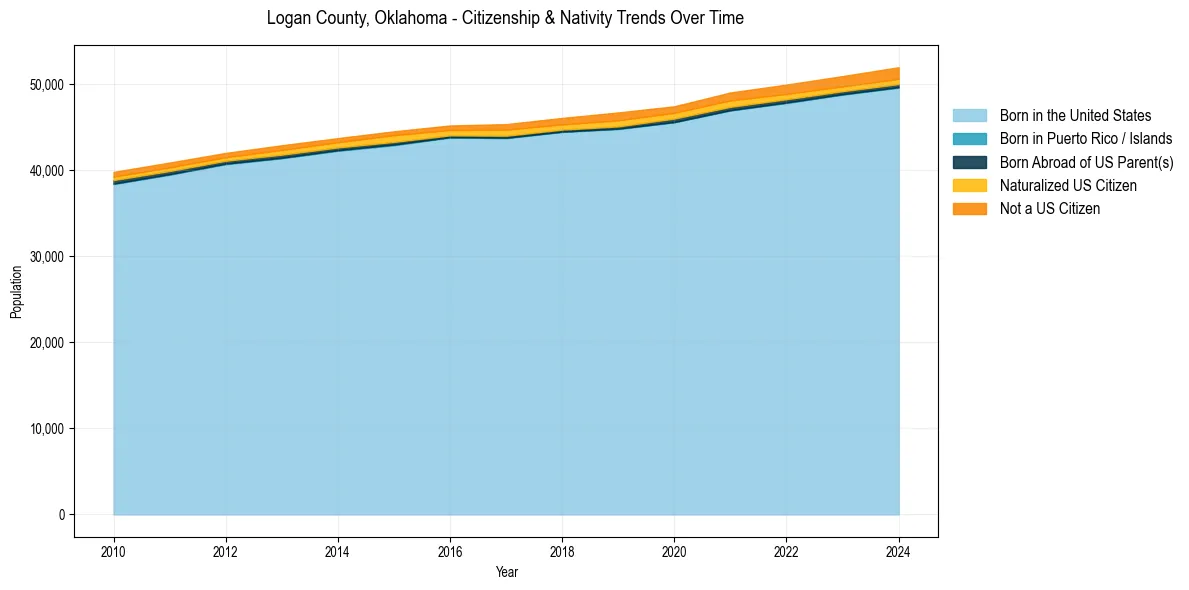
Logan County, Oklahoma Population & Nativity History
| Year | Total Pop | Foreign Born | Native Born |
|---|---|---|---|
| 2024 | 51,938 | 3.8% | 96.2% |
| 2023 | 50,905 | 3.4% | 96.6% |
| 2022 | 49,919 | 3.4% | 96.6% |
| 2021 | 49,005 | 3.4% | 96.6% |
| 2020 | 47,401 | 3.0% | 97.0% |
| 2019 | 46,683 | 3.5% | 96.5% |
| 2018 | 46,044 | 2.9% | 97.1% |
| 2017 | 45,326 | 3.0% | 97.0% |
| 2016 | 45,171 | 2.6% | 97.4% |
| 2015 | 44,493 | 2.8% | 97.2% |
| 2014 | 43,700 | 2.5% | 97.5% |
| 2013 | 42,871 | 2.6% | 97.4% |
| 2012 | 41,982 | 2.2% | 97.8% |
| 2011 | 40,863 | 2.4% | 97.6% |
| 2010 | 39,777 | 2.4% | 97.6% |
Nativity & Citizenship FAQs for Logan County, Oklahoma
Approximately 3.8% of residents in Logan County, Oklahoma were born outside the United States.
The vast majority of residents, roughly 97.4%, are U.S. citizens (including both native-born and naturalized citizens).