Kingfisher County, Oklahoma Nativity & Citizenship Status (2024)
Place of birth and citizenship status analysis for Kingfisher County, Oklahoma
Kingfisher County, Oklahoma Nativity & Citizenship Indicators (2024)
Native Born
91.5%
Foreign Born
8.5%
Naturalized
3.0%
US Citizens
94.5%
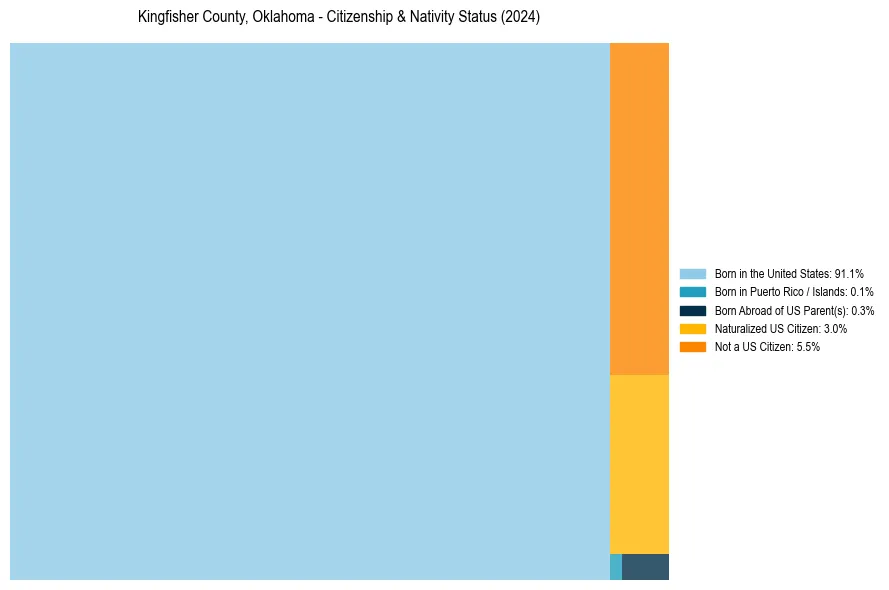
Kingfisher County, Oklahoma Nativity & Citizenship Distribution
Kingfisher County, Oklahoma Historical Nativity Trends (2010–2024)
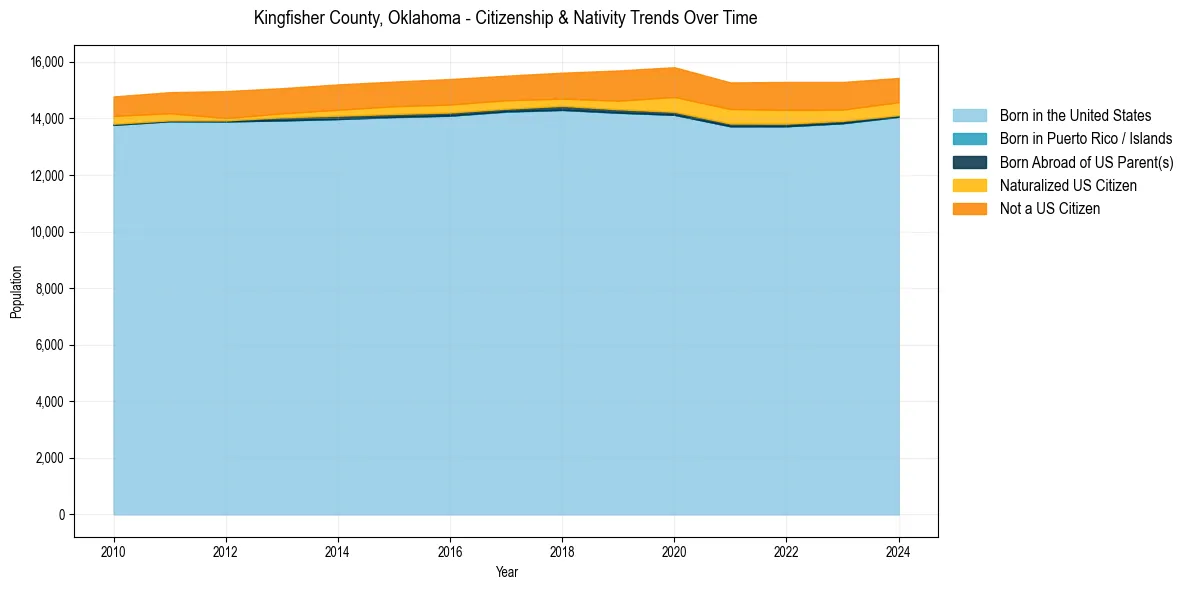
Kingfisher County, Oklahoma Population & Nativity History
| Year | Total Pop | Foreign Born | Native Born |
|---|---|---|---|
| 2024 | 15,430 | 8.5% | 91.5% |
| 2023 | 15,288 | 9.0% | 91.0% |
| 2022 | 15,290 | 9.7% | 90.3% |
| 2021 | 15,272 | 9.5% | 90.5% |
| 2020 | 15,811 | 10.0% | 90.0% |
| 2019 | 15,694 | 8.7% | 91.3% |
| 2018 | 15,618 | 7.5% | 92.5% |
| 2017 | 15,510 | 7.5% | 92.5% |
| 2016 | 15,392 | 7.7% | 92.3% |
| 2015 | 15,302 | 7.5% | 92.5% |
| 2014 | 15,202 | 7.3% | 92.7% |
| 2013 | 15,069 | 6.8% | 93.2% |
| 2012 | 14,965 | 6.9% | 93.1% |
| 2011 | 14,928 | 6.7% | 93.3% |
| 2010 | 14,776 | 6.5% | 93.5% |
Nativity & Citizenship FAQs for Kingfisher County, Oklahoma
Approximately 8.5% of residents in Kingfisher County, Oklahoma were born outside the United States.
The vast majority of residents, roughly 94.5%, are U.S. citizens (including both native-born and naturalized citizens).