Jackson County, Oklahoma Nativity & Citizenship Status (2024)
Place of birth and citizenship status analysis for Jackson County, Oklahoma
Jackson County, Oklahoma Nativity & Citizenship Indicators (2024)
Native Born
93.6%
Foreign Born
6.4%
Naturalized
3.1%
US Citizens
96.7%
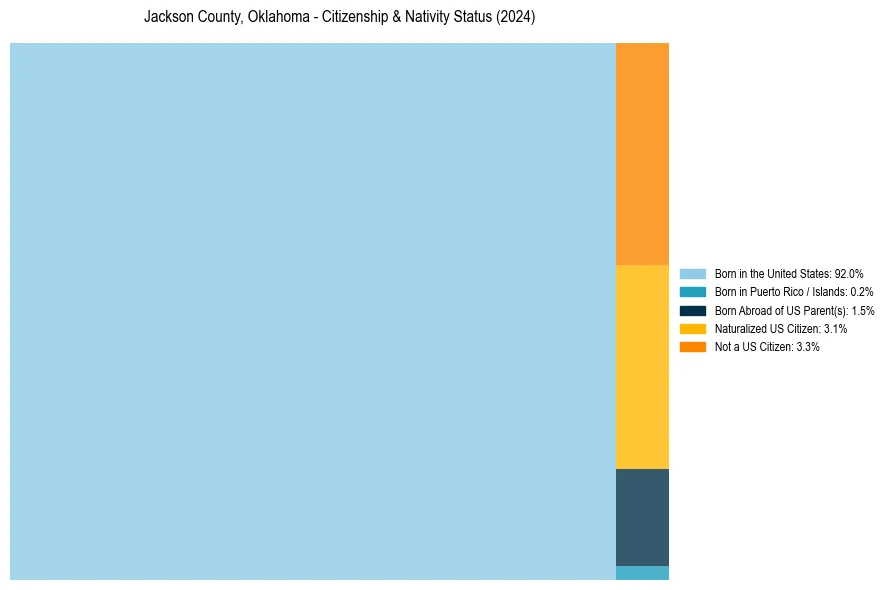
Jackson County, Oklahoma Nativity & Citizenship Distribution
Jackson County, Oklahoma Historical Nativity Trends (2010–2024)
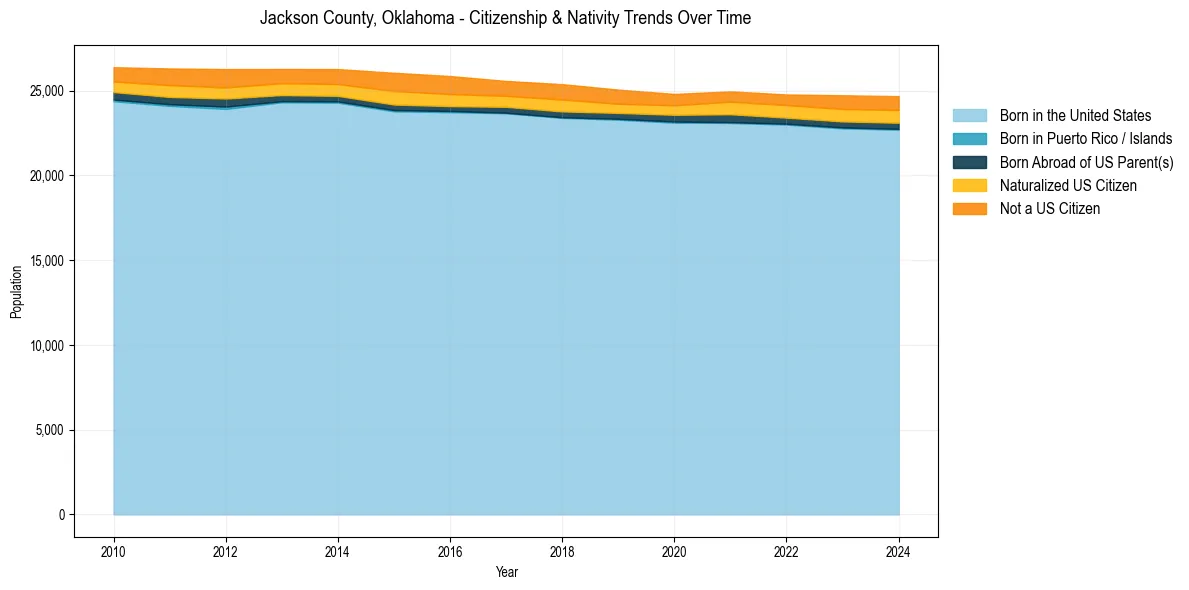
Jackson County, Oklahoma Population & Nativity History
| Year | Total Pop | Foreign Born | Native Born |
|---|---|---|---|
| 2024 | 24,678 | 6.4% | 93.6% |
| 2023 | 24,730 | 6.2% | 93.8% |
| 2022 | 24,776 | 5.5% | 94.5% |
| 2021 | 24,960 | 5.4% | 94.6% |
| 2020 | 24,808 | 5.0% | 95.0% |
| 2019 | 25,063 | 5.5% | 94.5% |
| 2018 | 25,384 | 6.3% | 93.7% |
| 2017 | 25,574 | 6.0% | 94.0% |
| 2016 | 25,864 | 6.9% | 93.1% |
| 2015 | 26,056 | 7.2% | 92.8% |
| 2014 | 26,275 | 6.0% | 94.0% |
| 2013 | 26,280 | 5.9% | 94.1% |
| 2012 | 26,275 | 6.6% | 93.4% |
| 2011 | 26,311 | 6.4% | 93.6% |
| 2010 | 26,386 | 5.6% | 94.4% |
Nativity & Citizenship FAQs for Jackson County, Oklahoma
Approximately 6.4% of residents in Jackson County, Oklahoma were born outside the United States.
The vast majority of residents, roughly 96.7%, are U.S. citizens (including both native-born and naturalized citizens).