Comanche County, Oklahoma Nativity & Citizenship Status (2024)
Place of birth and citizenship status analysis for Comanche County, Oklahoma
Comanche County, Oklahoma Nativity & Citizenship Indicators (2024)
Native Born
94.2%
Foreign Born
5.8%
Naturalized
3.1%
US Citizens
97.3%
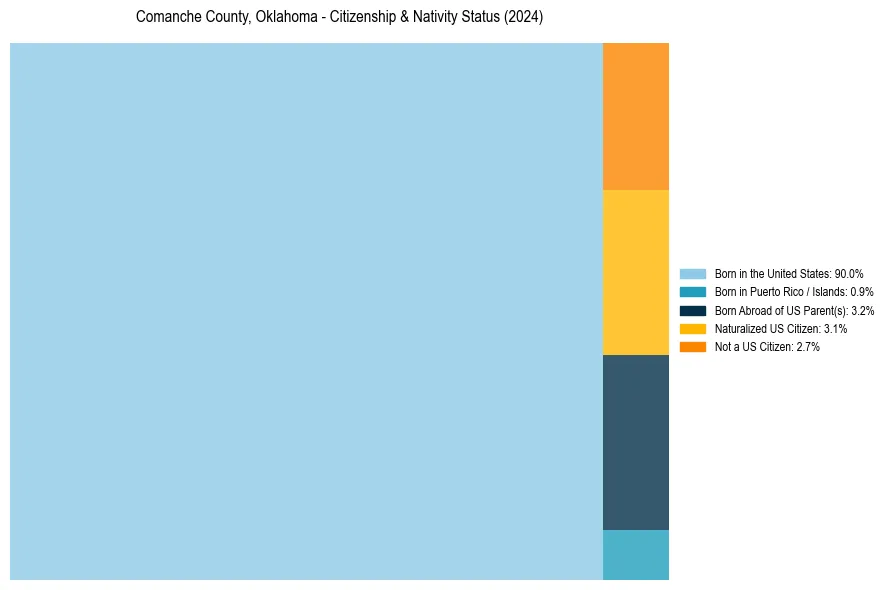
Comanche County, Oklahoma Nativity & Citizenship Distribution
Comanche County, Oklahoma Historical Nativity Trends (2010–2024)
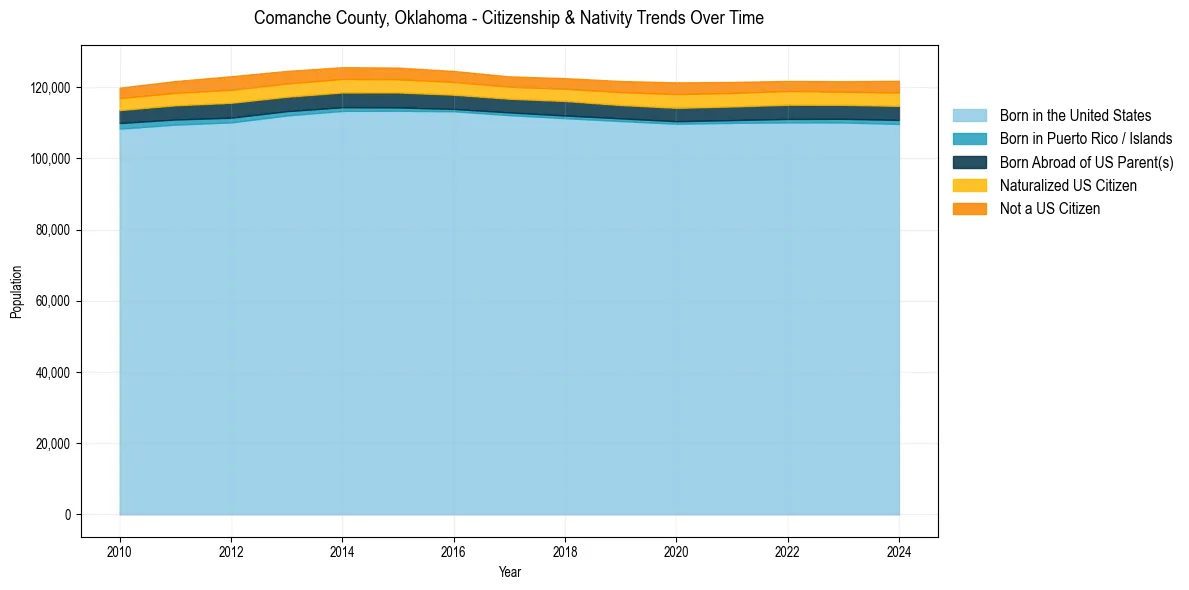
Comanche County, Oklahoma Population & Nativity History
| Year | Total Pop | Foreign Born | Native Born |
|---|---|---|---|
| 2024 | 121,825 | 5.8% | 94.2% |
| 2023 | 121,699 | 5.4% | 94.6% |
| 2022 | 121,777 | 5.5% | 94.5% |
| 2021 | 121,502 | 5.7% | 94.3% |
| 2020 | 121,374 | 5.9% | 94.1% |
| 2019 | 121,762 | 5.5% | 94.5% |
| 2018 | 122,561 | 5.2% | 94.8% |
| 2017 | 123,066 | 5.1% | 94.9% |
| 2016 | 124,583 | 5.4% | 94.6% |
| 2015 | 125,531 | 5.6% | 94.4% |
| 2014 | 125,647 | 5.7% | 94.3% |
| 2013 | 124,591 | 5.8% | 94.2% |
| 2012 | 123,101 | 6.1% | 93.9% |
| 2011 | 121,744 | 5.6% | 94.4% |
| 2010 | 119,902 | 5.3% | 94.7% |
Nativity & Citizenship FAQs for Comanche County, Oklahoma
Approximately 5.8% of residents in Comanche County, Oklahoma were born outside the United States.
The vast majority of residents, roughly 97.3%, are U.S. citizens (including both native-born and naturalized citizens).