Cleveland County, Oklahoma Nativity & Citizenship Status (2024)
Place of birth and citizenship status analysis for Cleveland County, Oklahoma
Cleveland County, Oklahoma Nativity & Citizenship Indicators (2024)
Native Born
93.4%
Foreign Born
6.6%
Naturalized
3.4%
US Citizens
96.7%
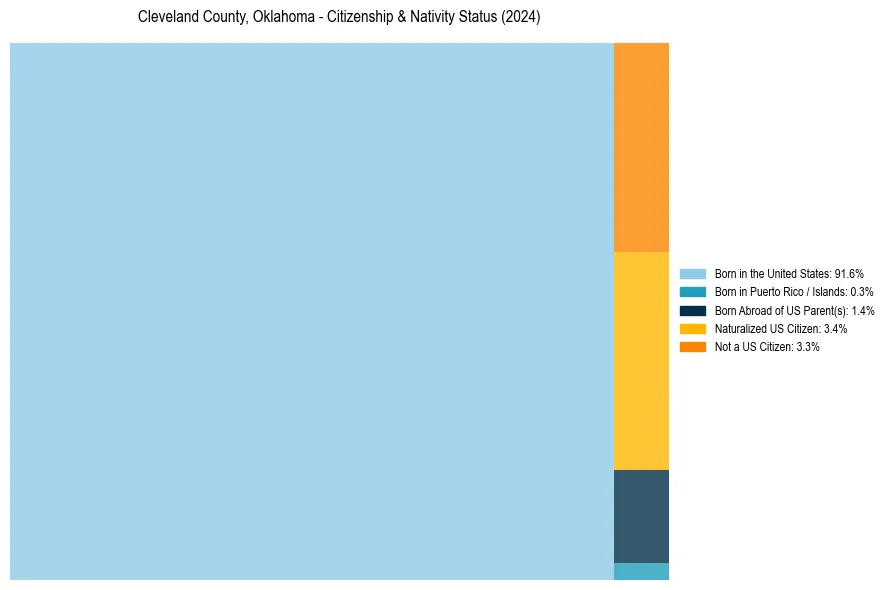
Cleveland County, Oklahoma Nativity & Citizenship Distribution
Cleveland County, Oklahoma Historical Nativity Trends (2010–2024)
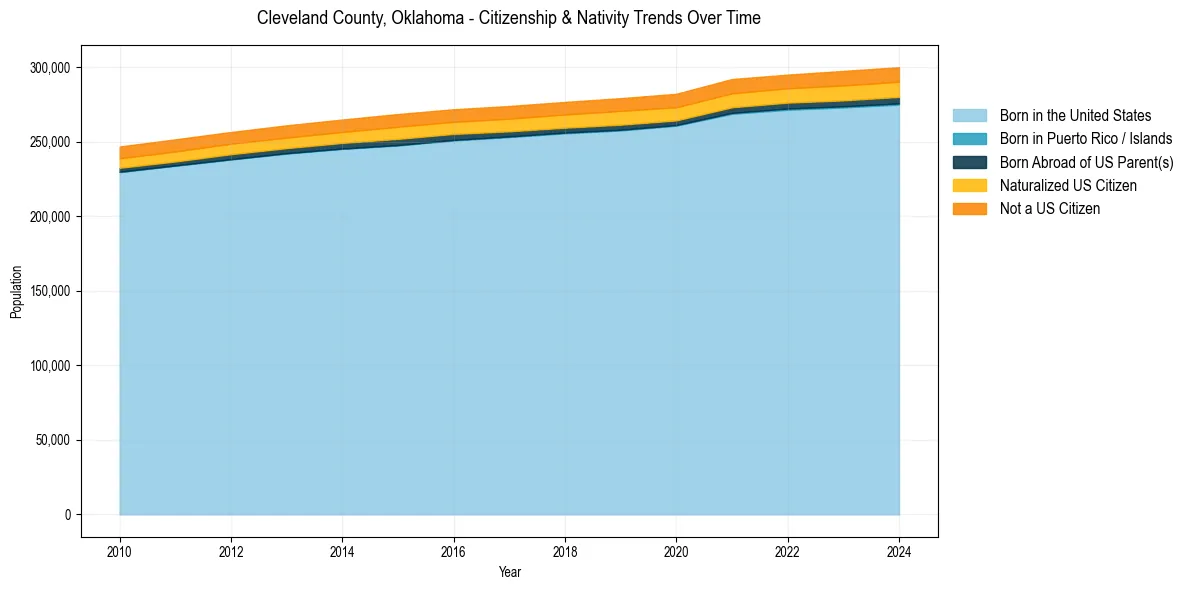
Cleveland County, Oklahoma Population & Nativity History
| Year | Total Pop | Foreign Born | Native Born |
|---|---|---|---|
| 2024 | 300,047 | 6.6% | 93.4% |
| 2023 | 297,545 | 6.6% | 93.4% |
| 2022 | 295,060 | 6.4% | 93.6% |
| 2021 | 292,110 | 6.5% | 93.5% |
| 2020 | 282,189 | 6.3% | 93.7% |
| 2019 | 279,274 | 6.4% | 93.6% |
| 2018 | 276,733 | 6.2% | 93.8% |
| 2017 | 274,024 | 6.2% | 93.8% |
| 2016 | 271,818 | 6.1% | 93.9% |
| 2015 | 268,614 | 6.2% | 93.8% |
| 2014 | 264,934 | 5.9% | 94.1% |
| 2013 | 261,047 | 5.9% | 94.1% |
| 2012 | 256,550 | 5.8% | 94.2% |
| 2011 | 251,643 | 5.9% | 94.1% |
| 2010 | 246,831 | 5.8% | 94.2% |
Nativity & Citizenship FAQs for Cleveland County, Oklahoma
Approximately 6.6% of residents in Cleveland County, Oklahoma were born outside the United States.
The vast majority of residents, roughly 96.7%, are U.S. citizens (including both native-born and naturalized citizens).