Oklahoma Employment Sector Statistics (2024)
Workforce distribution by employment sector for Oklahoma
Employment Indicators for Oklahoma (2024)
Total Employed
1,825,720
Civilian 16+
Private For-Profit
68.0 %
Largest Sector
Self-Employed
6.7%
Entrepreneurship
Government
17.7%
Public Sector
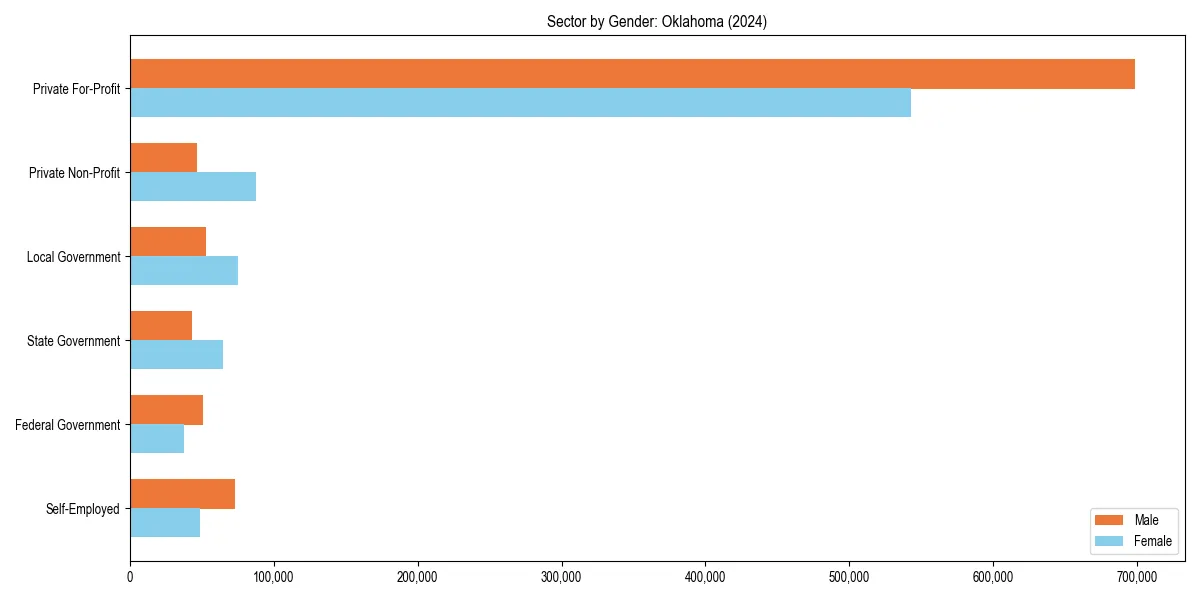
Oklahoma Workforce by Sector & Gender
Oklahoma Employment Sector Breakdown
| Sector | Total Workers | Percentage |
|---|---|---|
| Private For-Profit | 1,241,670 | 68.0% |
| Government | 323,913 | 17.7% |
| Self-Employed | 121,676 | 6.7% |
| Private Non-Profit | 134,476 | 7.4% |
Oklahoma Gender Ratio Analysis by Employment Sector (2024)
| Sector | Male:Female Ratio |
|---|---|
| Private For-Profit | 1.29:1 |
| Government | 0.83:1 |
| Self-Employed | 1.49:1 |
Oklahoma Employment Trends (2010–2024)
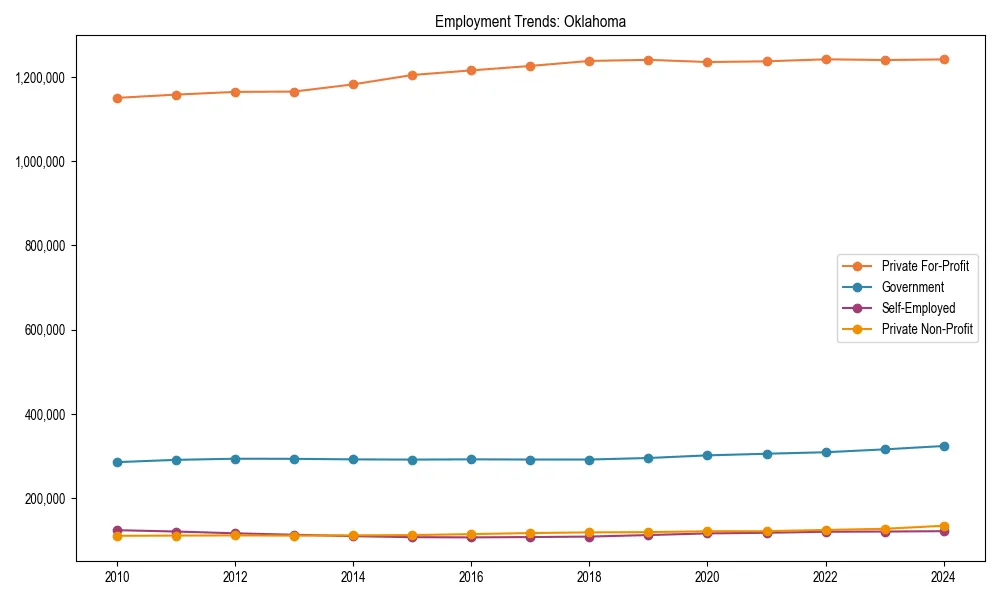
Oklahoma Historical Employment Sector Trends
| Year | Private | Gov | Self-Emp | Non-Profit |
|---|---|---|---|---|
| 2024 | 68.0% | 17.7% | 6.7% | 7.4% |
| 2023 | 68.6% | 17.5% | 6.7% | 7.0% |
| 2022 | 69.0% | 17.2% | 6.7% | 6.9% |
| 2021 | 69.2% | 17.1% | 6.6% | 6.8% |
| 2020 | 69.4% | 17.0% | 6.5% | 6.8% |
| 2019 | 70.0% | 16.7% | 6.3% | 6.7% |
| 2018 | 70.3% | 16.6% | 6.2% | 6.7% |
| 2017 | 70.2% | 16.7% | 6.2% | 6.7% |
| 2016 | 70.1% | 16.9% | 6.2% | 6.6% |
| 2015 | 70.1% | 17.0% | 6.2% | 6.5% |
| 2014 | 69.6% | 17.2% | 6.5% | 6.6% |
| 2013 | 69.1% | 17.4% | 6.7% | 6.6% |
| 2012 | 68.9% | 17.4% | 6.9% | 6.6% |
| 2011 | 68.7% | 17.3% | 7.2% | 6.6% |
| 2010 | 68.7% | 17.1% | 7.4% | 6.6% |
Employment Sector FAQs for Oklahoma
The largest employment sector in Oklahoma is Private For-Profit, which employs 68.0% of the local workforce.
There are approximately 1,825,720 civilian workers aged 16 and over currently employed in Oklahoma.
In the private for-profit sector, the male-to-female ratio is 1.29:1. This metric helps highlight gender participation across the most prominent industry classes.
Since 2010, the total number of workers in Oklahoma has shown an increase, moving from 1,674,765 to 1,825,720 according to Census Bureau records.