Canadian County, Oklahoma Nativity & Citizenship Status (2024)
Place of birth and citizenship status analysis for Canadian County, Oklahoma
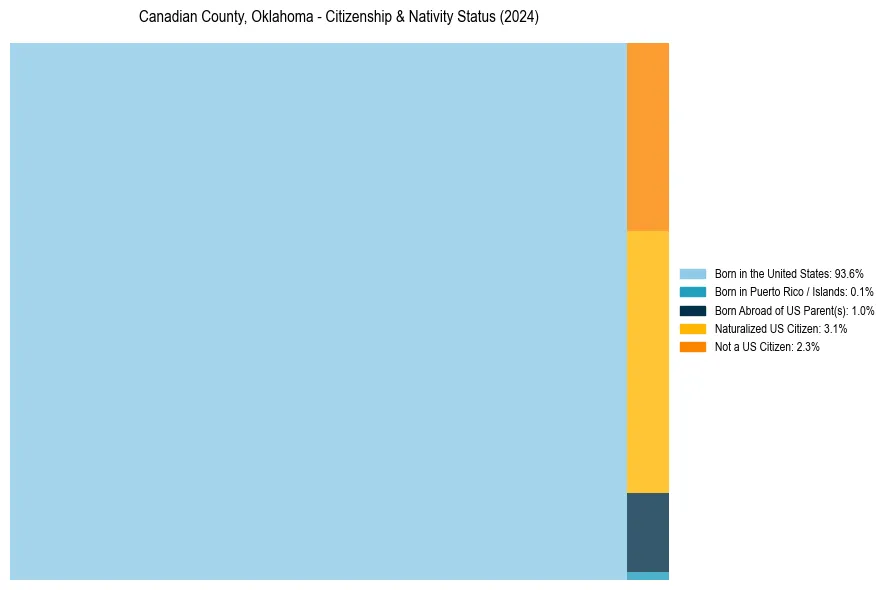
Canadian County, Oklahoma Nativity & Citizenship Indicators (2024)
Native Born
94.6%
Foreign Born
5.4%
Naturalized
3.1%
US Citizens
97.7%
Canadian County, Oklahoma Nativity & Citizenship Distribution
Canadian County, Oklahoma Historical Nativity Trends (2010–2024)
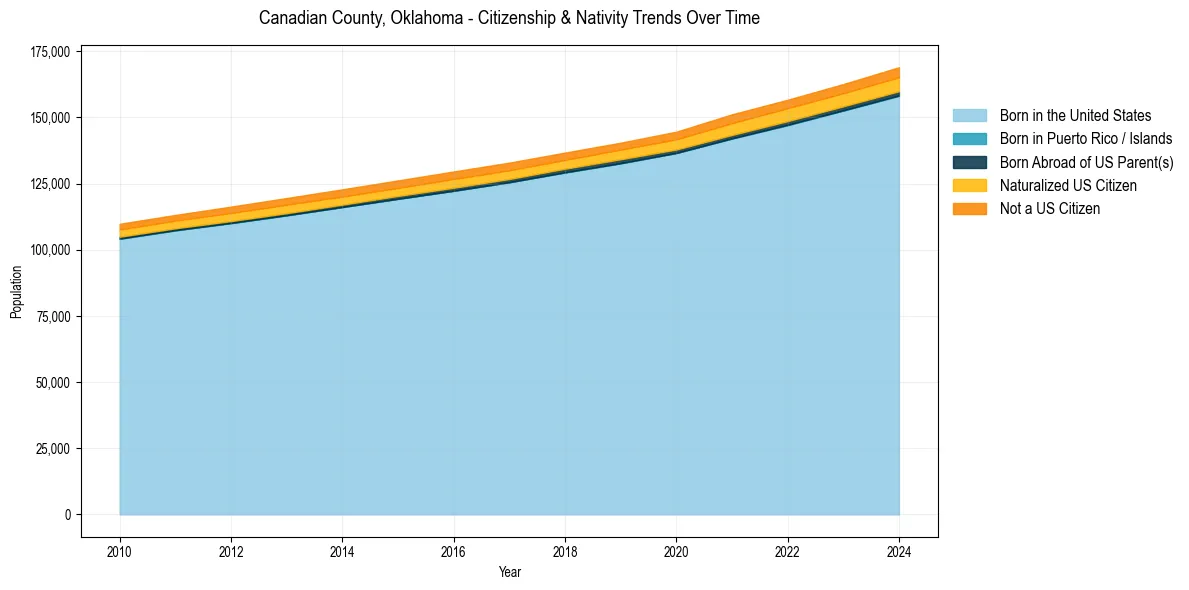
Canadian County, Oklahoma Population & Nativity History
| Year | Total Pop | Foreign Born | Native Born |
|---|---|---|---|
| 2024 | 168,985 | 5.4% | 94.6% |
| 2023 | 162,621 | 5.2% | 94.8% |
| 2022 | 156,681 | 5.2% | 94.8% |
| 2021 | 151,174 | 5.2% | 94.8% |
| 2020 | 144,610 | 4.7% | 95.3% |
| 2019 | 140,455 | 4.5% | 95.5% |
| 2018 | 136,710 | 4.5% | 95.5% |
| 2017 | 132,922 | 4.7% | 95.3% |
| 2016 | 129,571 | 4.8% | 95.2% |
| 2015 | 126,193 | 4.6% | 95.4% |
| 2014 | 122,832 | 4.7% | 95.3% |
| 2013 | 119,546 | 4.8% | 95.2% |
| 2012 | 116,299 | 4.7% | 95.3% |
| 2011 | 113,154 | 4.5% | 95.5% |
| 2010 | 109,814 | 4.5% | 95.5% |
Nativity & Citizenship FAQs for Canadian County, Oklahoma
Approximately 5.4% of residents in Canadian County, Oklahoma were born outside the United States.
The vast majority of residents, roughly 97.7%, are U.S. citizens (including both native-born and naturalized citizens).