Wood County, Ohio Nativity & Citizenship Status (2024)
Place of birth and citizenship status analysis for Wood County, Ohio
Wood County, Ohio Nativity & Citizenship Indicators (2024)
Native Born
96.2%
Foreign Born
3.8%
Naturalized
1.9%
US Citizens
98.2%
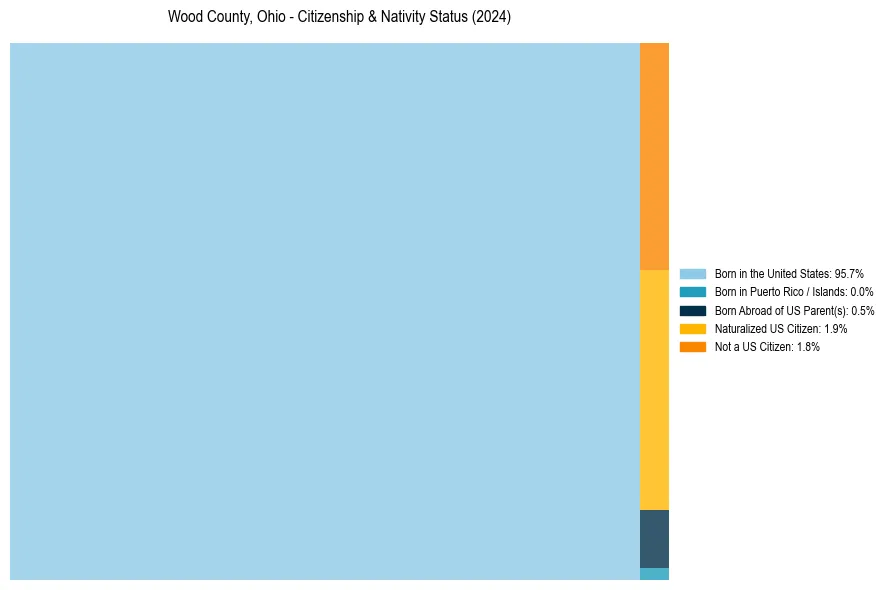
Wood County, Ohio Nativity & Citizenship Distribution
Wood County, Ohio Historical Nativity Trends (2010–2024)
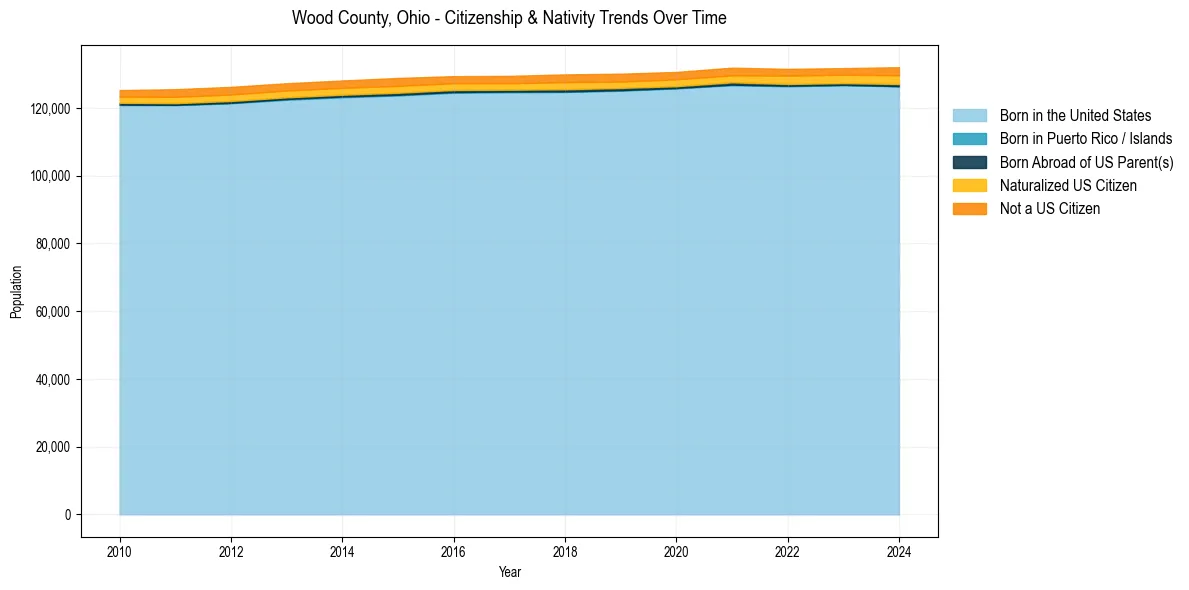
Wood County, Ohio Population & Nativity History
| Year | Total Pop | Foreign Born | Native Born |
|---|---|---|---|
| 2024 | 132,064 | 3.8% | 96.2% |
| 2023 | 131,795 | 3.4% | 96.6% |
| 2022 | 131,564 | 3.4% | 96.6% |
| 2021 | 131,930 | 3.3% | 96.7% |
| 2020 | 130,662 | 3.2% | 96.8% |
| 2019 | 130,150 | 3.2% | 96.8% |
| 2018 | 129,936 | 3.4% | 96.6% |
| 2017 | 129,504 | 3.2% | 96.8% |
| 2016 | 129,418 | 3.1% | 96.9% |
| 2015 | 128,885 | 3.4% | 96.6% |
| 2014 | 128,139 | 3.3% | 96.7% |
| 2013 | 127,325 | 3.3% | 96.7% |
| 2012 | 126,254 | 3.3% | 96.7% |
| 2011 | 125,566 | 3.3% | 96.7% |
| 2010 | 125,295 | 3.0% | 97.0% |
Nativity & Citizenship FAQs for Wood County, Ohio
Approximately 3.8% of residents in Wood County, Ohio were born outside the United States.
The vast majority of residents, roughly 98.2%, are U.S. citizens (including both native-born and naturalized citizens).