Ohio Nativity & Citizenship Status (2024)
Place of birth and citizenship status analysis for Ohio
Ohio Nativity & Citizenship Indicators (2024)
Native Born
94.8%
Foreign Born
5.2%
Naturalized
2.8%
US Citizens
97.5%
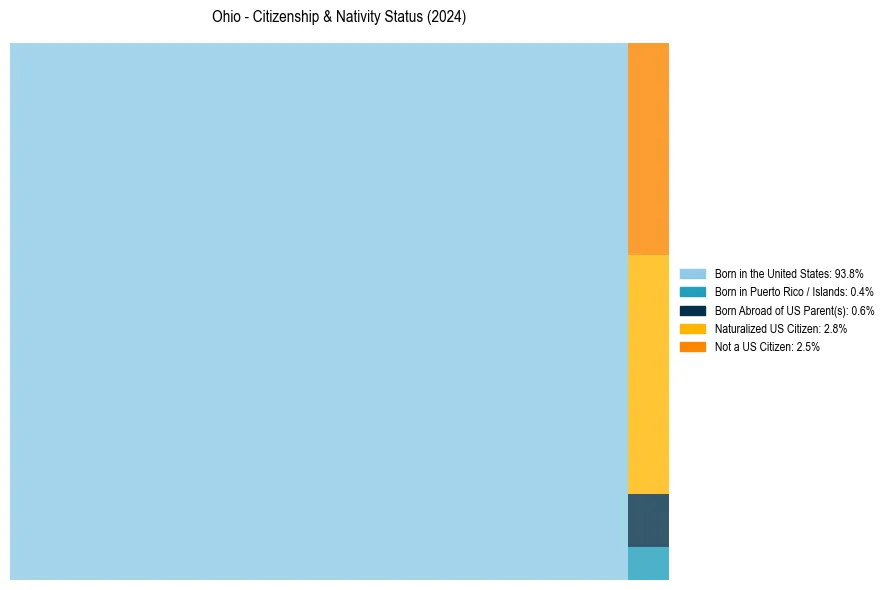
Ohio Nativity & Citizenship Distribution
Ohio Historical Nativity Trends (2010–2024)
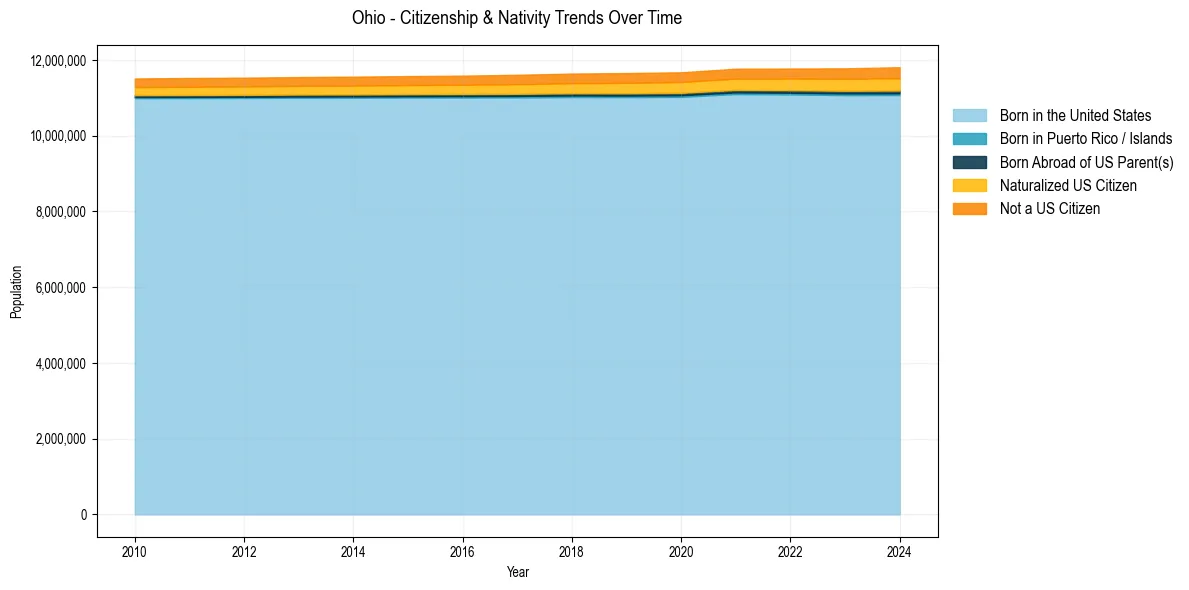
Ohio Population & Nativity History
| Year | Total Pop | Foreign Born | Native Born |
|---|---|---|---|
| 2024 | 11,810,293 | 5.2% | 94.8% |
| 2023 | 11,780,046 | 5.0% | 95.0% |
| 2022 | 11,774,683 | 4.9% | 95.1% |
| 2021 | 11,769,923 | 4.8% | 95.2% |
| 2020 | 11,675,275 | 4.6% | 95.4% |
| 2019 | 11,655,397 | 4.6% | 95.4% |
| 2018 | 11,641,879 | 4.5% | 95.5% |
| 2017 | 11,609,756 | 4.3% | 95.7% |
| 2016 | 11,586,941 | 4.2% | 95.8% |
| 2015 | 11,575,977 | 4.1% | 95.9% |
| 2014 | 11,560,380 | 4.1% | 95.9% |
| 2013 | 11,549,590 | 4.0% | 96.0% |
| 2012 | 11,533,561 | 3.9% | 96.1% |
| 2011 | 11,525,536 | 3.9% | 96.1% |
| 2010 | 11,512,431 | 3.8% | 96.2% |
Nativity & Citizenship FAQs for Ohio
Approximately 5.2% of residents in Ohio were born outside the United States.
The vast majority of residents, roughly 97.5%, are U.S. citizens (including both native-born and naturalized citizens).