Morgan County, Ohio Nativity & Citizenship Status (2024)
Place of birth and citizenship status analysis for Morgan County, Ohio
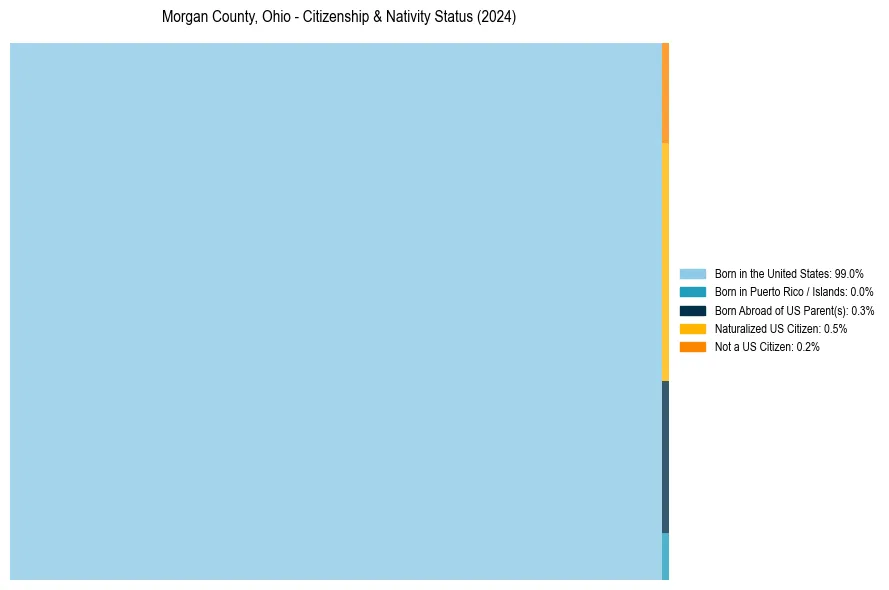
Morgan County, Ohio Nativity & Citizenship Indicators (2024)
Native Born
99.3%
Foreign Born
0.7%
Naturalized
0.5%
US Citizens
99.8%
Morgan County, Ohio Nativity & Citizenship Distribution
Morgan County, Ohio Historical Nativity Trends (2010–2024)
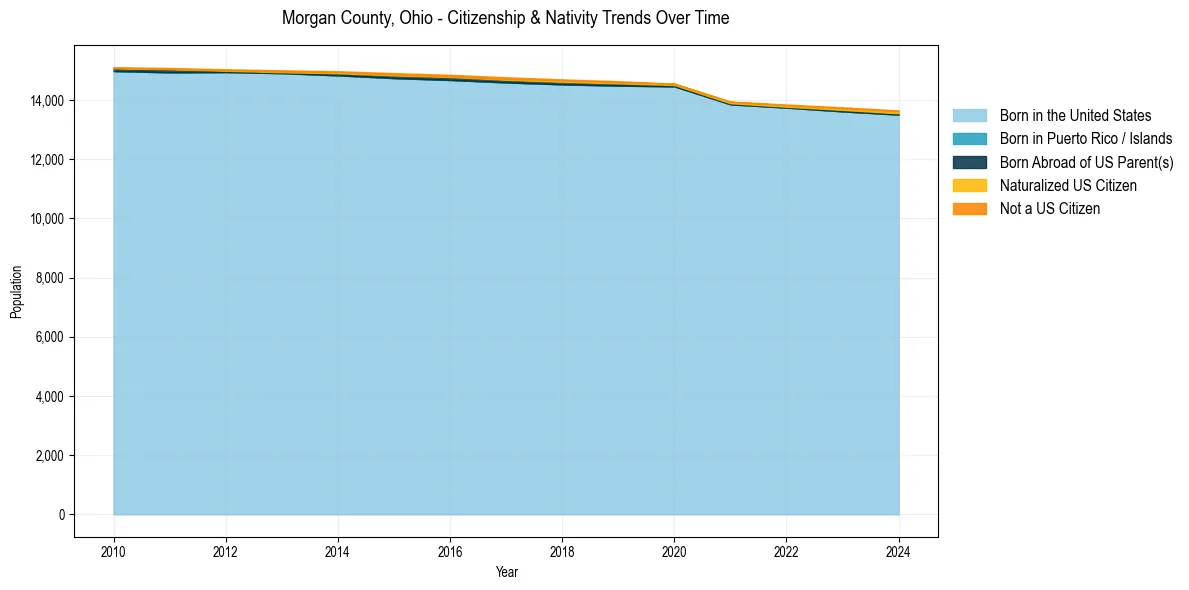
Morgan County, Ohio Population & Nativity History
| Year | Total Pop | Foreign Born | Native Born |
|---|---|---|---|
| 2024 | 13,651 | 0.7% | 99.3% |
| 2023 | 13,758 | 0.7% | 99.3% |
| 2022 | 13,851 | 0.5% | 99.5% |
| 2021 | 13,955 | 0.4% | 99.6% |
| 2020 | 14,557 | 0.3% | 99.7% |
| 2019 | 14,640 | 0.5% | 99.5% |
| 2018 | 14,702 | 0.6% | 99.4% |
| 2017 | 14,773 | 0.6% | 99.4% |
| 2016 | 14,857 | 0.5% | 99.5% |
| 2015 | 14,913 | 0.5% | 99.5% |
| 2014 | 14,977 | 0.5% | 99.5% |
| 2013 | 15,008 | 0.4% | 99.6% |
| 2012 | 15,042 | 0.3% | 99.7% |
| 2011 | 15,087 | 0.3% | 99.7% |
| 2010 | 15,113 | 0.2% | 99.8% |
Nativity & Citizenship FAQs for Morgan County, Ohio
Approximately 0.7% of residents in Morgan County, Ohio were born outside the United States.
The vast majority of residents, roughly 99.8%, are U.S. citizens (including both native-born and naturalized citizens).