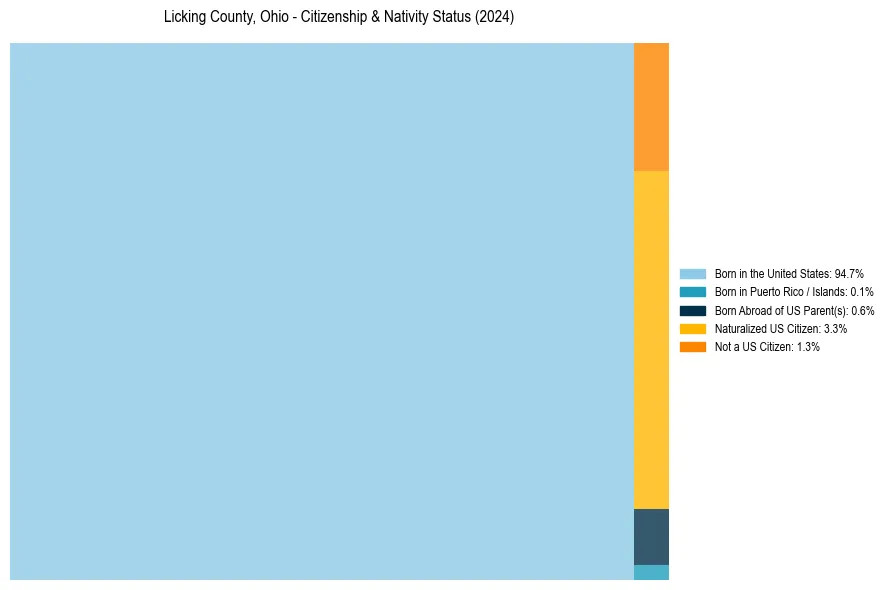
Licking County, Ohio Nativity & Citizenship Status (2024)
Place of birth and citizenship status analysis for Licking County, Ohio
Licking County, Ohio Nativity & Citizenship Indicators (2024)
Native Born
95.4%
Foreign Born
4.6%
Naturalized
3.3%
US Citizens
98.7%
Licking County, Ohio Nativity & Citizenship Distribution
Licking County, Ohio Historical Nativity Trends (2010–2024)
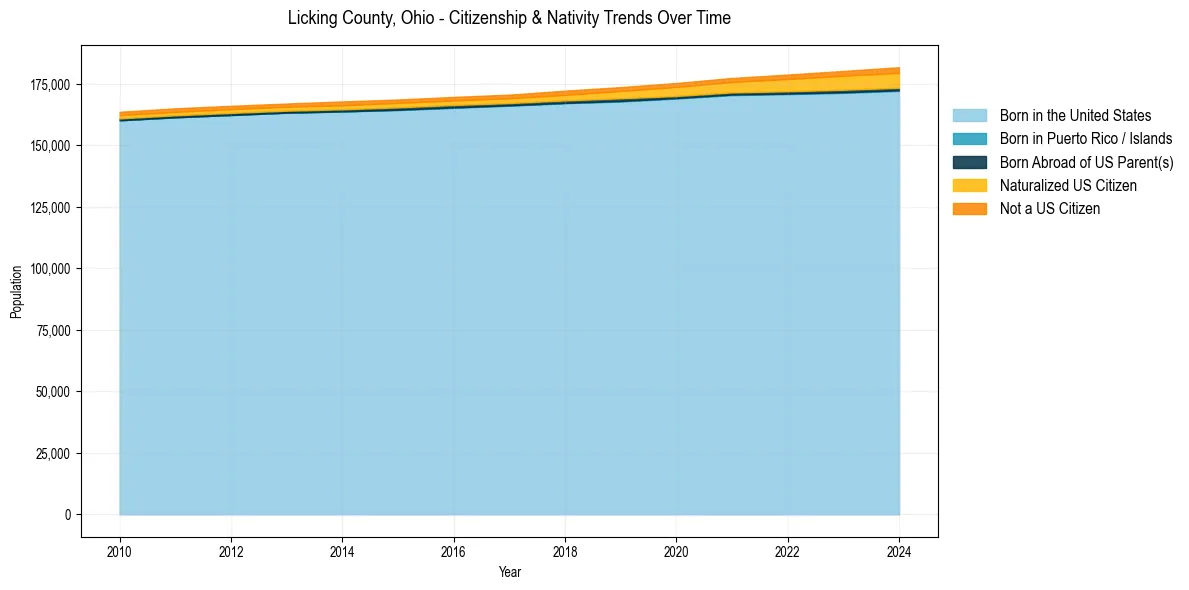
Licking County, Ohio Population & Nativity History
| Year | Total Pop | Foreign Born | Native Born |
|---|---|---|---|
| 2024 | 181,837 | 4.6% | 95.4% |
| 2023 | 180,311 | 4.2% | 95.8% |
| 2022 | 178,844 | 3.8% | 96.2% |
| 2021 | 177,454 | 3.3% | 96.7% |
| 2020 | 175,409 | 3.0% | 97.0% |
| 2019 | 173,750 | 2.6% | 97.4% |
| 2018 | 172,293 | 2.3% | 97.7% |
| 2017 | 170,678 | 2.0% | 98.0% |
| 2016 | 169,762 | 1.9% | 98.1% |
| 2015 | 168,693 | 1.9% | 98.1% |
| 2014 | 167,911 | 1.9% | 98.1% |
| 2013 | 167,065 | 1.7% | 98.3% |
| 2012 | 166,135 | 1.7% | 98.3% |
| 2011 | 165,110 | 1.7% | 98.3% |
| 2010 | 163,708 | 1.6% | 98.4% |
Nativity & Citizenship FAQs for Licking County, Ohio
Approximately 4.6% of residents in Licking County, Ohio were born outside the United States.
The vast majority of residents, roughly 98.7%, are U.S. citizens (including both native-born and naturalized citizens).