Licking County, Ohio Education Statistics (2024)
Degree attainment and educational level analysis for Licking County, Ohio
Licking County, Ohio Educational Indicators (2024)
HS Grad or Higher
93.5%
Bachelor's Degree+
29.3%
Graduate Degree
9.8%
Population 25+
124,267
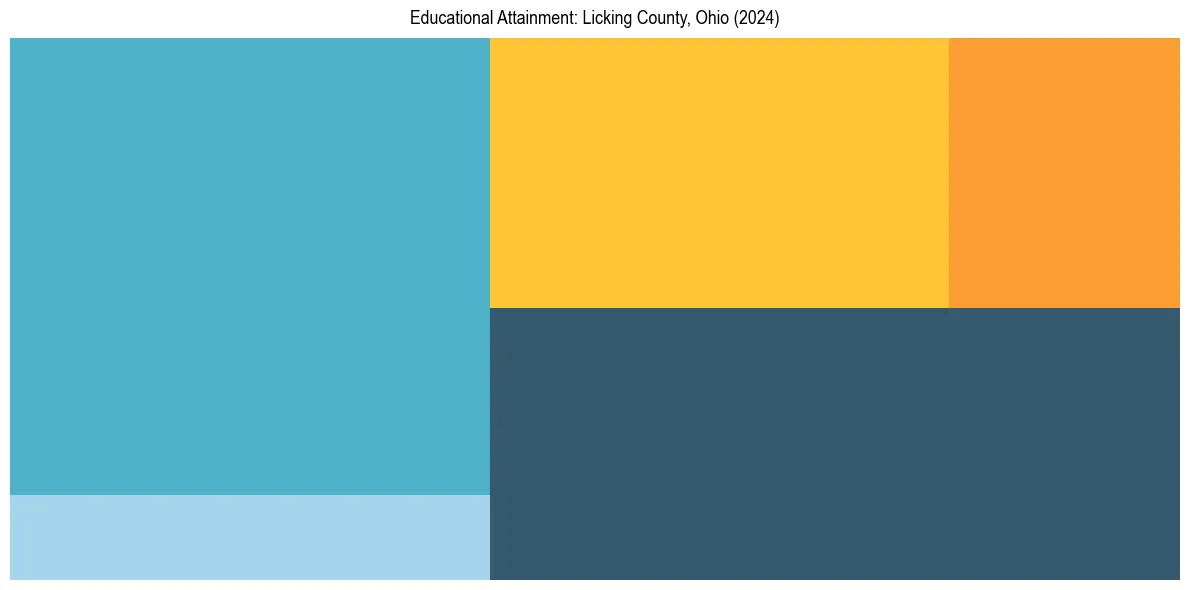
Licking County, Ohio Educational Level Distribution
Licking County, Ohio Detailed Attainment Breakdown
| Level of Education | Percentage | Count |
|---|---|---|
Less than High School | 6.5% | 8,039 |
High School Graduate | 34.6% | 42,971 |
Some College / Associate's | 29.6% | 36,790 |
Bachelor's Degree | 19.5% | 24,256 |
Graduate Degree | 9.8% | 12,211 |
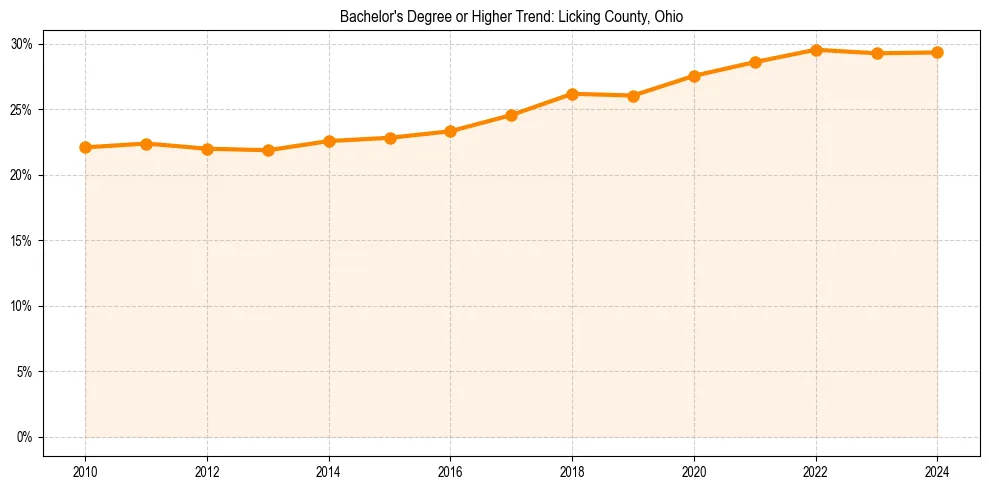
Licking County, Ohio Higher Education Trends (2010–2024)
Education Statistics FAQs for Licking County, Ohio
Approximately 29.3% of adults in Licking County, Ohio hold a Bachelor's degree or higher.
Since 2010, the percentage of residents with a college degree in Licking County, Ohio has increased by 7.2 percentage points, indicating a growing workforce.