Lake County, Ohio Nativity & Citizenship Status (2024)
Place of birth and citizenship status analysis for Lake County, Ohio
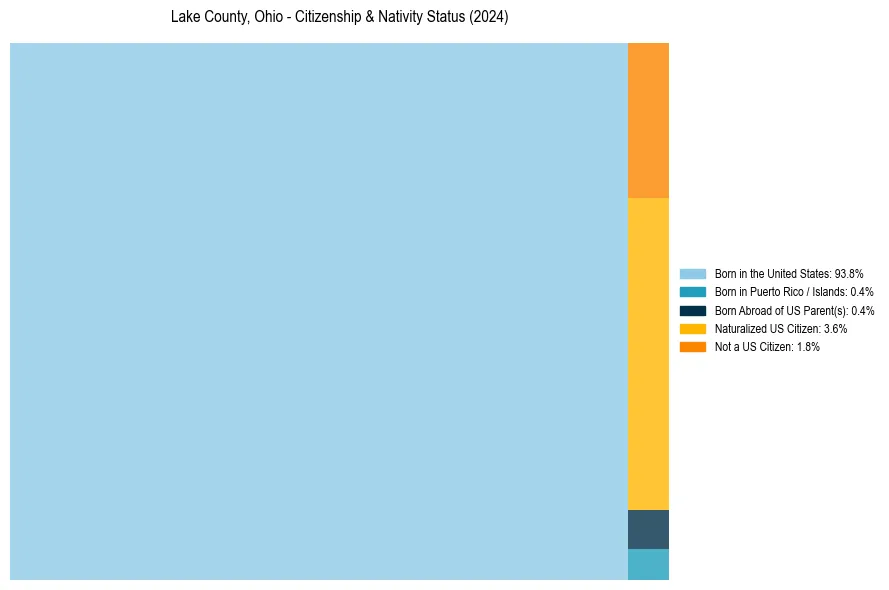
Lake County, Ohio Nativity & Citizenship Indicators (2024)
Native Born
94.6%
Foreign Born
5.4%
Naturalized
3.6%
US Citizens
98.2%
Lake County, Ohio Nativity & Citizenship Distribution
Lake County, Ohio Historical Nativity Trends (2010–2024)
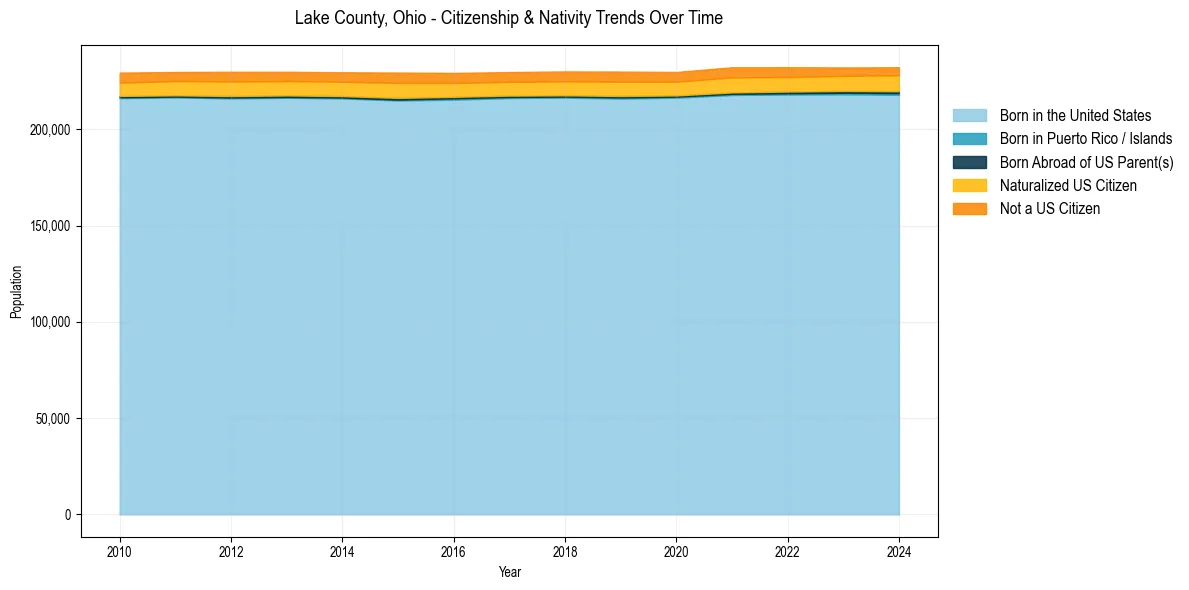
Lake County, Ohio Population & Nativity History
| Year | Total Pop | Foreign Born | Native Born |
|---|---|---|---|
| 2024 | 232,216 | 5.4% | 94.6% |
| 2023 | 232,101 | 5.2% | 94.8% |
| 2022 | 232,236 | 5.4% | 94.6% |
| 2021 | 232,202 | 5.6% | 94.4% |
| 2020 | 229,755 | 5.3% | 94.7% |
| 2019 | 229,954 | 5.5% | 94.5% |
| 2018 | 230,052 | 5.4% | 94.6% |
| 2017 | 229,701 | 5.3% | 94.7% |
| 2016 | 229,266 | 5.4% | 94.6% |
| 2015 | 229,437 | 5.7% | 94.3% |
| 2014 | 229,602 | 5.4% | 94.6% |
| 2013 | 229,850 | 5.3% | 94.7% |
| 2012 | 229,873 | 5.5% | 94.5% |
| 2011 | 229,745 | 5.3% | 94.7% |
| 2010 | 229,418 | 5.3% | 94.7% |
Nativity & Citizenship FAQs for Lake County, Ohio
Approximately 5.4% of residents in Lake County, Ohio were born outside the United States.
The vast majority of residents, roughly 98.2%, are U.S. citizens (including both native-born and naturalized citizens).