Franklin County, Ohio Nativity & Citizenship Status (2024)
Place of birth and citizenship status analysis for Franklin County, Ohio
Franklin County, Ohio Nativity & Citizenship Indicators (2024)
Native Born
87.0%
Foreign Born
13.0%
Naturalized
6.4%
US Citizens
93.4%
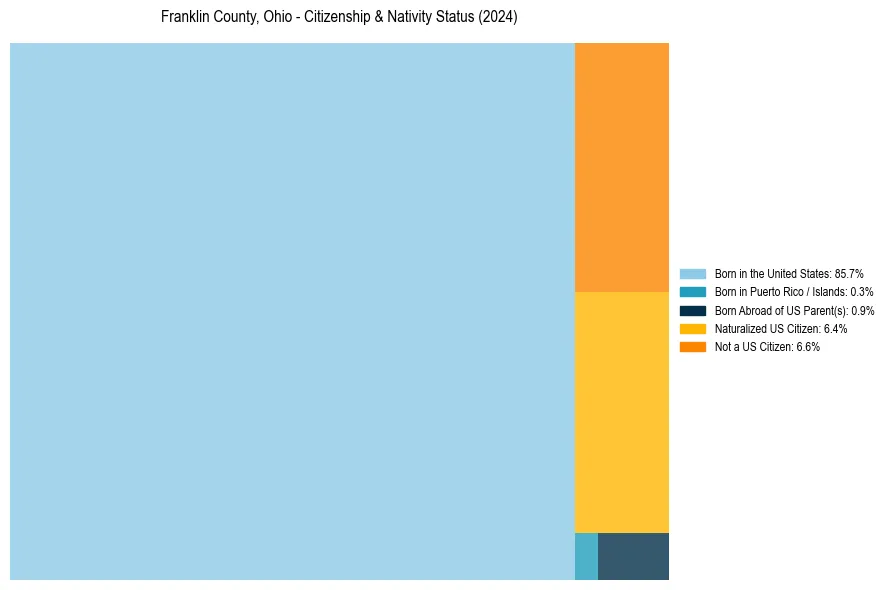
Franklin County, Ohio Nativity & Citizenship Distribution
Franklin County, Ohio Historical Nativity Trends (2010–2024)
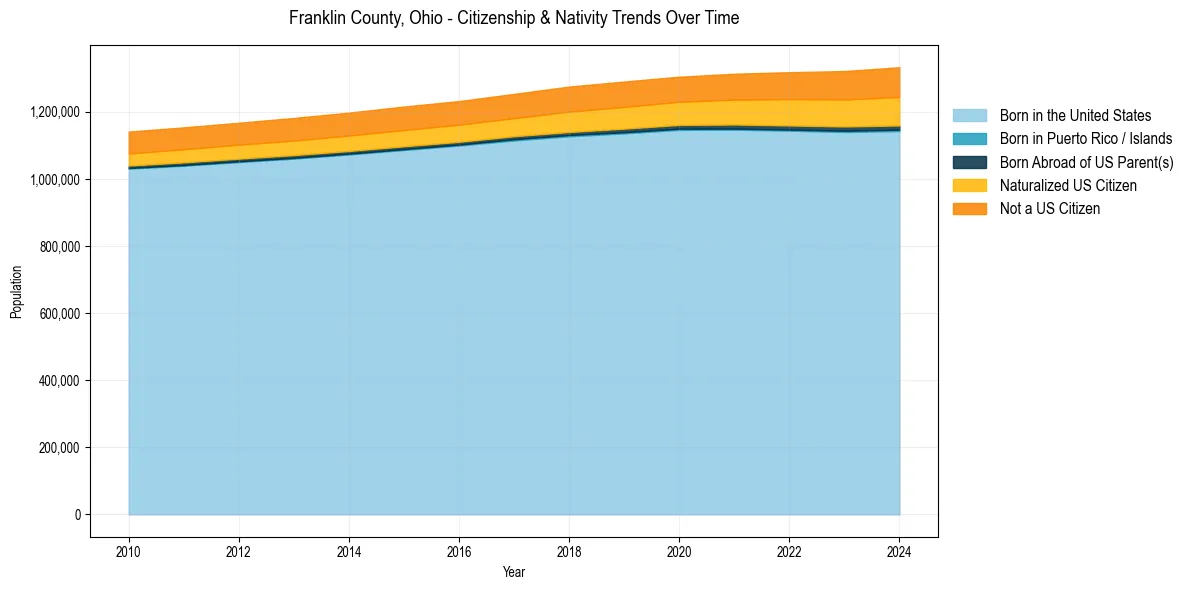
Franklin County, Ohio Population & Nativity History
| Year | Total Pop | Foreign Born | Native Born |
|---|---|---|---|
| 2024 | 1,333,048 | 13.0% | 87.0% |
| 2023 | 1,321,635 | 12.5% | 87.5% |
| 2022 | 1,318,149 | 12.0% | 88.0% |
| 2021 | 1,313,598 | 11.5% | 88.5% |
| 2020 | 1,304,715 | 11.0% | 89.0% |
| 2019 | 1,290,360 | 10.9% | 89.1% |
| 2018 | 1,275,333 | 10.6% | 89.4% |
| 2017 | 1,253,507 | 10.1% | 89.9% |
| 2016 | 1,232,118 | 9.9% | 90.1% |
| 2015 | 1,215,761 | 9.8% | 90.2% |
| 2014 | 1,197,592 | 9.6% | 90.4% |
| 2013 | 1,181,824 | 9.4% | 90.6% |
| 2012 | 1,167,484 | 9.2% | 90.8% |
| 2011 | 1,153,671 | 9.0% | 91.0% |
| 2010 | 1,141,117 | 8.9% | 91.1% |
Nativity & Citizenship FAQs for Franklin County, Ohio
Approximately 13.0% of residents in Franklin County, Ohio were born outside the United States.
The vast majority of residents, roughly 93.4%, are U.S. citizens (including both native-born and naturalized citizens).