Cuyahoga County, Ohio Nativity & Citizenship Status (2024)
Place of birth and citizenship status analysis for Cuyahoga County, Ohio
Cuyahoga County, Ohio Nativity & Citizenship Indicators (2024)
Native Born
92.3%
Foreign Born
7.7%
Naturalized
4.7%
US Citizens
97.0%
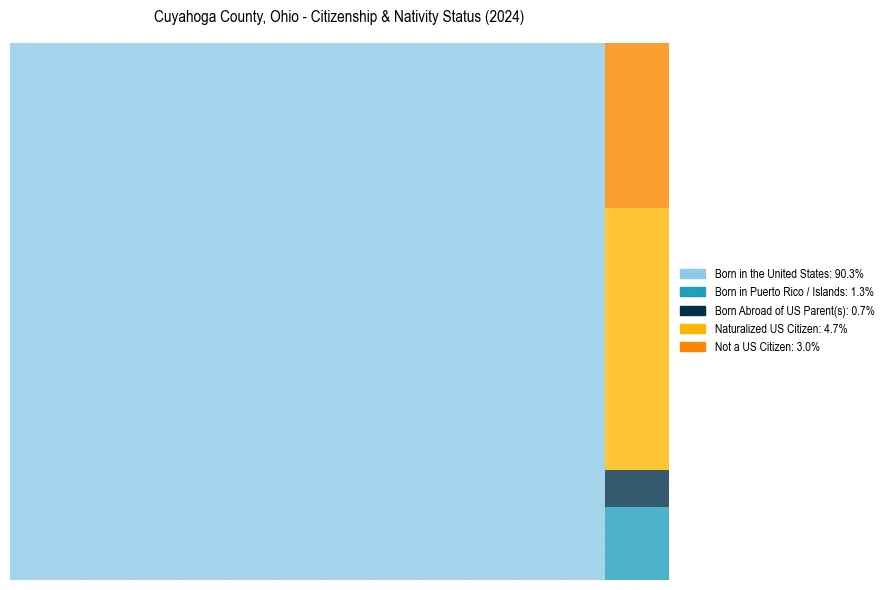
Cuyahoga County, Ohio Nativity & Citizenship Distribution
Cuyahoga County, Ohio Historical Nativity Trends (2010–2024)
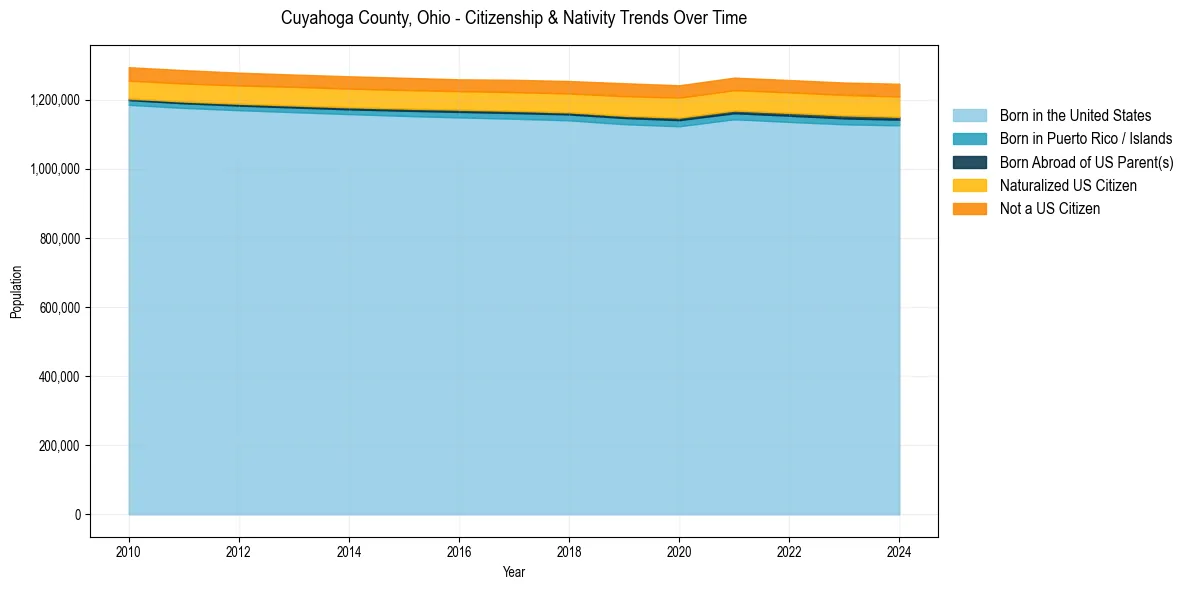
Cuyahoga County, Ohio Population & Nativity History
| Year | Total Pop | Foreign Born | Native Born |
|---|---|---|---|
| 2024 | 1,245,873 | 7.7% | 92.3% |
| 2023 | 1,249,418 | 7.6% | 92.4% |
| 2022 | 1,256,620 | 7.6% | 92.4% |
| 2021 | 1,263,667 | 7.5% | 92.5% |
| 2020 | 1,241,475 | 7.6% | 92.4% |
| 2019 | 1,247,451 | 7.6% | 92.4% |
| 2018 | 1,253,783 | 7.2% | 92.8% |
| 2017 | 1,257,401 | 7.1% | 92.9% |
| 2016 | 1,258,710 | 7.0% | 93.0% |
| 2015 | 1,263,189 | 7.1% | 92.9% |
| 2014 | 1,267,513 | 7.1% | 92.9% |
| 2013 | 1,272,533 | 7.0% | 93.0% |
| 2012 | 1,278,024 | 7.0% | 93.0% |
| 2011 | 1,285,279 | 7.1% | 92.9% |
| 2010 | 1,293,825 | 7.0% | 93.0% |
Nativity & Citizenship FAQs for Cuyahoga County, Ohio
Approximately 7.7% of residents in Cuyahoga County, Ohio were born outside the United States.
The vast majority of residents, roughly 97.0%, are U.S. citizens (including both native-born and naturalized citizens).