Belmont County, Ohio Nativity & Citizenship Status (2024)
Place of birth and citizenship status analysis for Belmont County, Ohio
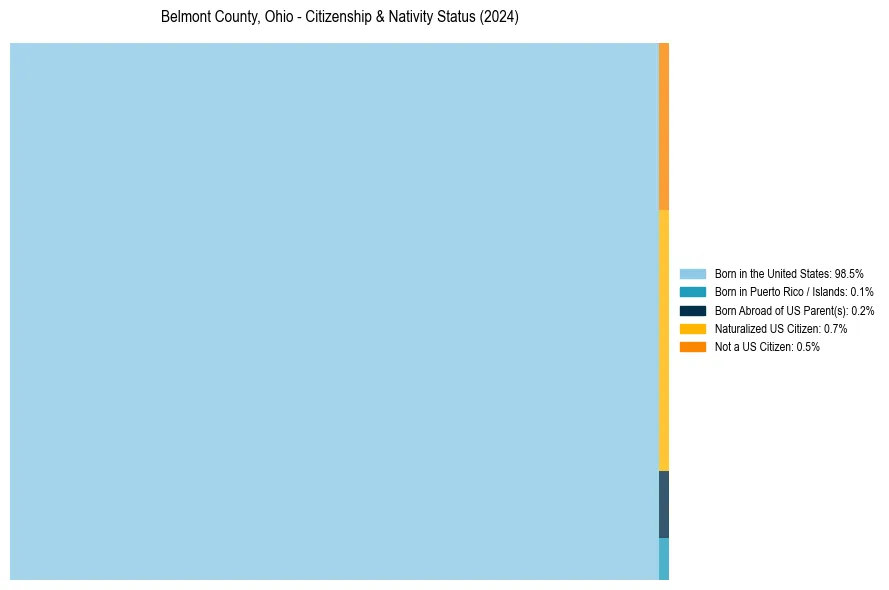
Belmont County, Ohio Nativity & Citizenship Indicators (2024)
Native Born
98.8%
Foreign Born
1.2%
Naturalized
0.7%
US Citizens
99.5%
Belmont County, Ohio Nativity & Citizenship Distribution
Belmont County, Ohio Historical Nativity Trends (2010–2024)
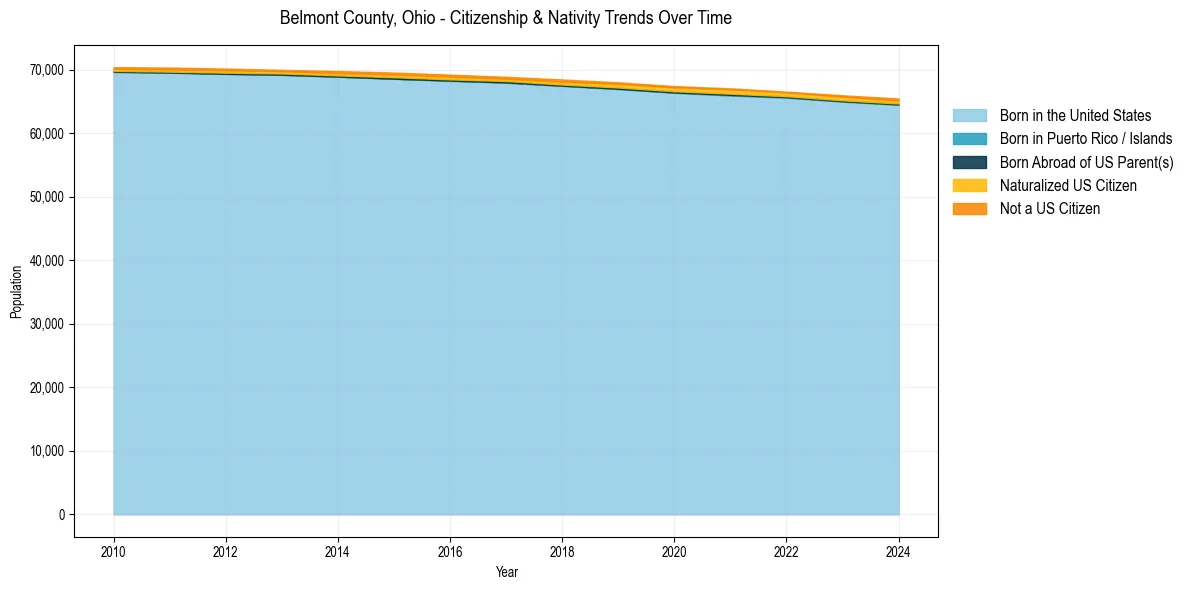
Belmont County, Ohio Population & Nativity History
| Year | Total Pop | Foreign Born | Native Born |
|---|---|---|---|
| 2024 | 65,473 | 1.2% | 98.8% |
| 2023 | 65,982 | 1.2% | 98.8% |
| 2022 | 66,554 | 1.1% | 98.9% |
| 2021 | 67,077 | 1.3% | 98.7% |
| 2020 | 67,424 | 1.2% | 98.8% |
| 2019 | 68,024 | 1.2% | 98.8% |
| 2018 | 68,472 | 1.2% | 98.8% |
| 2017 | 68,889 | 1.0% | 99.0% |
| 2016 | 69,228 | 1.1% | 98.9% |
| 2015 | 69,560 | 1.1% | 98.9% |
| 2014 | 69,793 | 1.0% | 99.0% |
| 2013 | 69,990 | 0.8% | 99.2% |
| 2012 | 70,182 | 0.9% | 99.1% |
| 2011 | 70,346 | 0.9% | 99.1% |
| 2010 | 70,403 | 0.8% | 99.2% |
Nativity & Citizenship FAQs for Belmont County, Ohio
Approximately 1.2% of residents in Belmont County, Ohio were born outside the United States.
The vast majority of residents, roughly 99.5%, are U.S. citizens (including both native-born and naturalized citizens).