Athens County, Ohio Nativity & Citizenship Status (2024)
Place of birth and citizenship status analysis for Athens County, Ohio
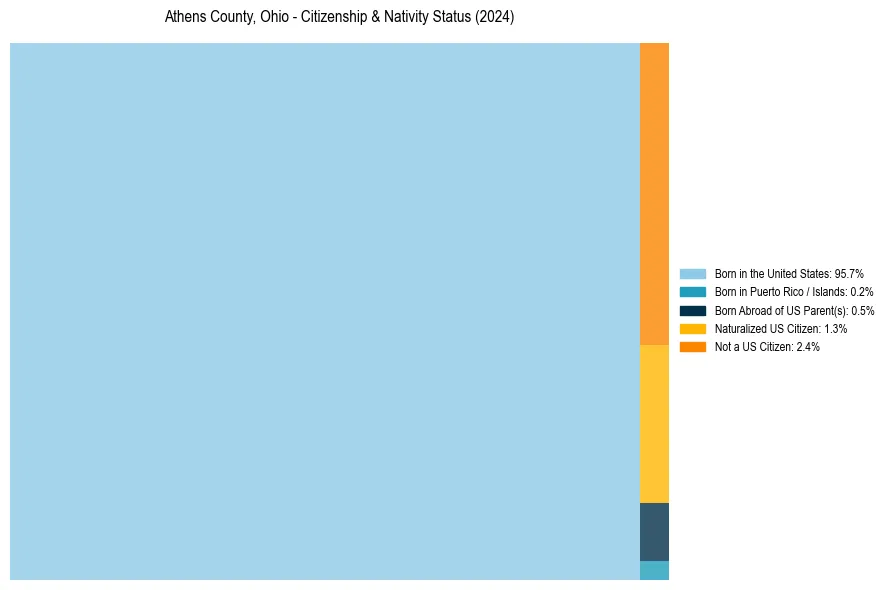
Athens County, Ohio Nativity & Citizenship Indicators (2024)
Native Born
96.3%
Foreign Born
3.7%
Naturalized
1.3%
US Citizens
97.6%
Athens County, Ohio Nativity & Citizenship Distribution
Athens County, Ohio Historical Nativity Trends (2010–2024)
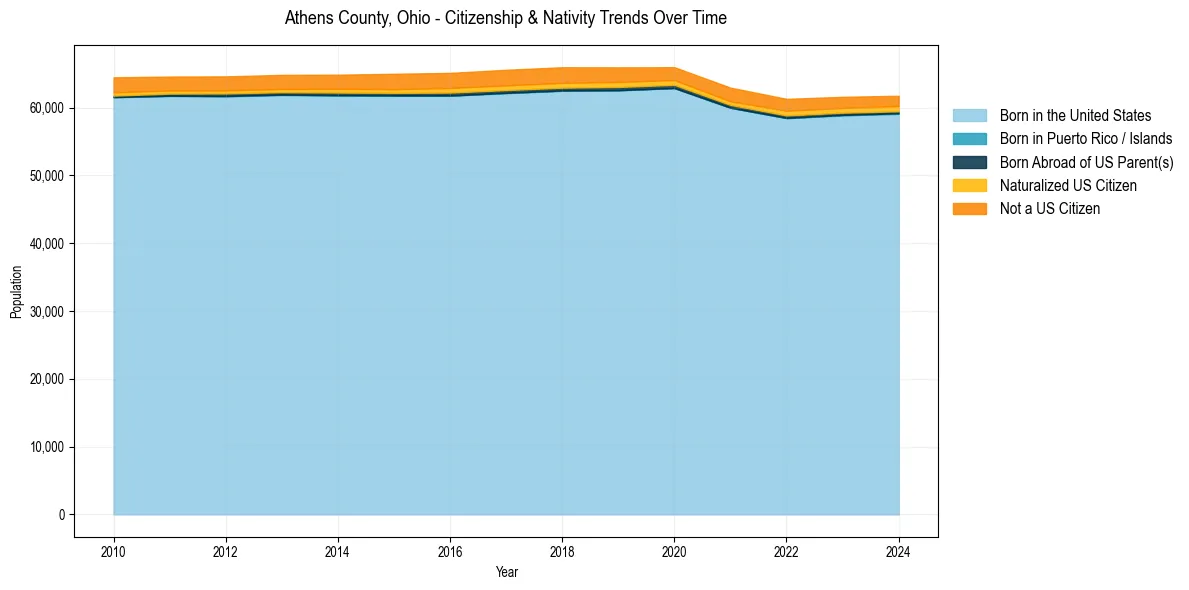
Athens County, Ohio Population & Nativity History
| Year | Total Pop | Foreign Born | Native Born |
|---|---|---|---|
| 2024 | 61,737 | 3.7% | 96.3% |
| 2023 | 61,573 | 3.8% | 96.2% |
| 2022 | 61,276 | 4.0% | 96.0% |
| 2021 | 62,933 | 4.1% | 95.9% |
| 2020 | 65,945 | 4.0% | 96.0% |
| 2019 | 65,917 | 4.4% | 95.6% |
| 2018 | 65,936 | 4.6% | 95.4% |
| 2017 | 65,563 | 4.6% | 95.4% |
| 2016 | 65,103 | 4.5% | 95.5% |
| 2015 | 64,974 | 4.3% | 95.7% |
| 2014 | 64,840 | 4.1% | 95.9% |
| 2013 | 64,811 | 3.9% | 96.1% |
| 2012 | 64,592 | 3.9% | 96.1% |
| 2011 | 64,562 | 3.9% | 96.1% |
| 2010 | 64,455 | 4.2% | 95.8% |
Nativity & Citizenship FAQs for Athens County, Ohio
Approximately 3.7% of residents in Athens County, Ohio were born outside the United States.
The vast majority of residents, roughly 97.6%, are U.S. citizens (including both native-born and naturalized citizens).