Ashtabula County, Ohio Nativity & Citizenship Status (2024)
Place of birth and citizenship status analysis for Ashtabula County, Ohio
Ashtabula County, Ohio Nativity & Citizenship Indicators (2024)
Native Born
98.1%
Foreign Born
1.9%
Naturalized
0.9%
US Citizens
99.1%
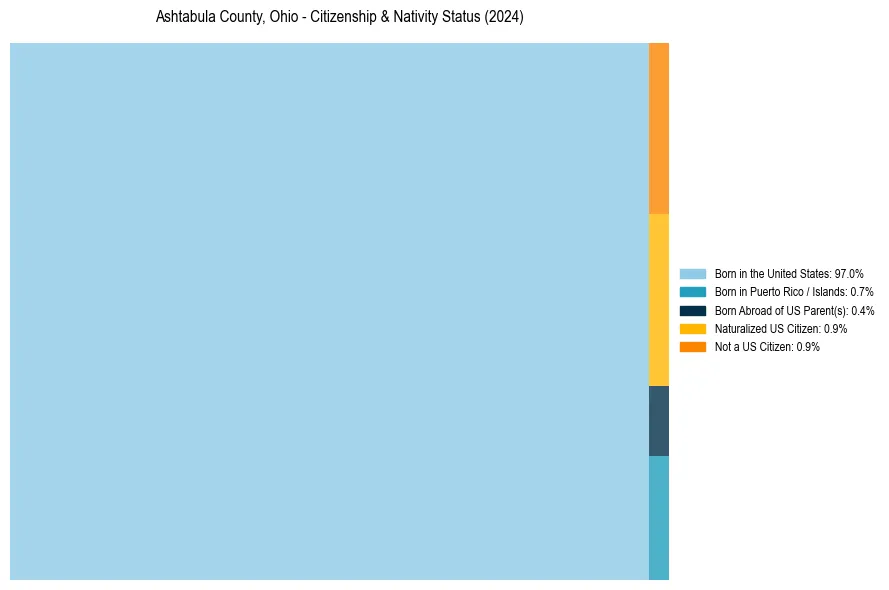
Ashtabula County, Ohio Nativity & Citizenship Distribution
Ashtabula County, Ohio Historical Nativity Trends (2010–2024)
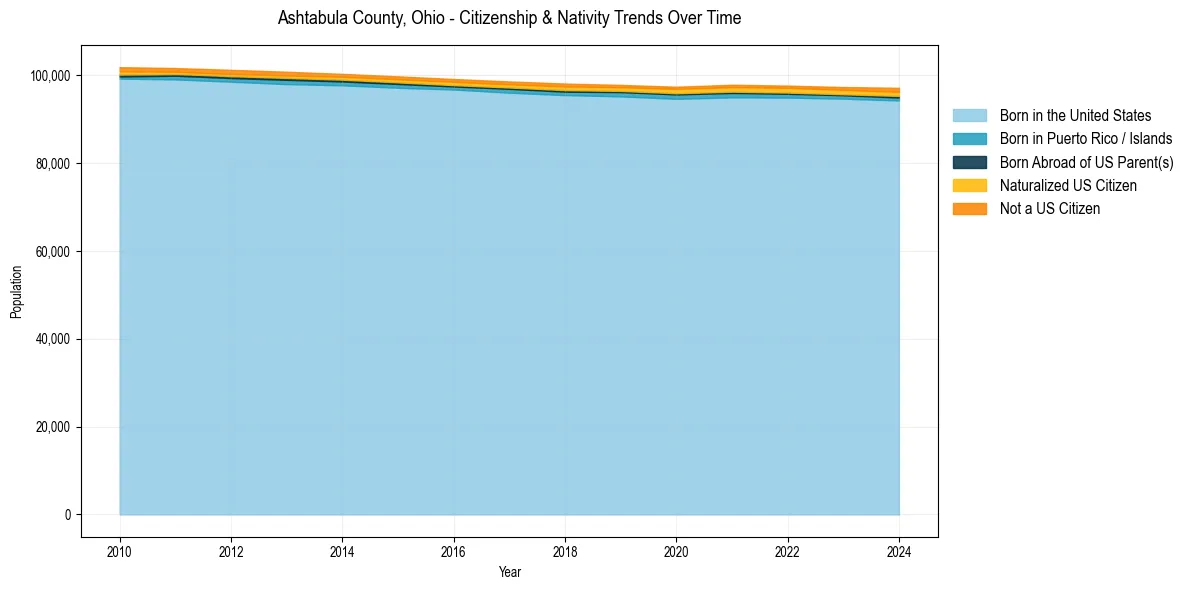
Ashtabula County, Ohio Population & Nativity History
| Year | Total Pop | Foreign Born | Native Born |
|---|---|---|---|
| 2024 | 97,167 | 1.9% | 98.1% |
| 2023 | 97,343 | 1.7% | 98.3% |
| 2022 | 97,666 | 1.6% | 98.4% |
| 2021 | 97,869 | 1.6% | 98.4% |
| 2020 | 97,416 | 1.5% | 98.5% |
| 2019 | 97,830 | 1.4% | 98.6% |
| 2018 | 98,136 | 1.5% | 98.5% |
| 2017 | 98,622 | 1.4% | 98.6% |
| 2016 | 99,175 | 1.4% | 98.6% |
| 2015 | 99,777 | 1.4% | 98.6% |
| 2014 | 100,346 | 1.3% | 98.7% |
| 2013 | 100,835 | 1.4% | 98.6% |
| 2012 | 101,262 | 1.4% | 98.6% |
| 2011 | 101,676 | 1.3% | 98.7% |
| 2010 | 101,867 | 1.6% | 98.4% |
Nativity & Citizenship FAQs for Ashtabula County, Ohio
Approximately 1.9% of residents in Ashtabula County, Ohio were born outside the United States.
The vast majority of residents, roughly 99.1%, are U.S. citizens (including both native-born and naturalized citizens).