Allen County, Ohio Nativity & Citizenship Status (2024)
Place of birth and citizenship status analysis for Allen County, Ohio
Allen County, Ohio Nativity & Citizenship Indicators (2024)
Native Born
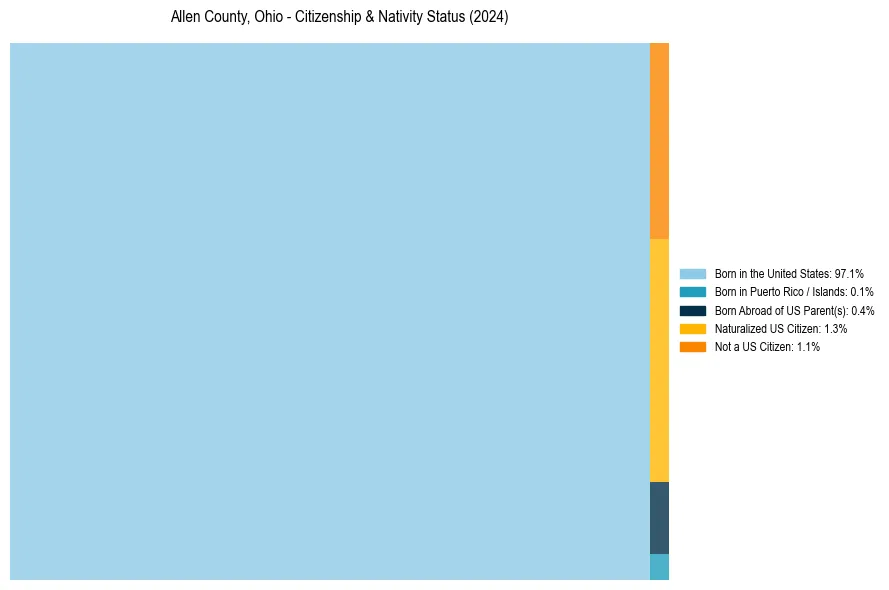
97.6%
Foreign Born
2.4%
Naturalized
1.3%
US Citizens
98.9%
Allen County, Ohio Nativity & Citizenship Distribution
Allen County, Ohio Historical Nativity Trends (2010–2024)
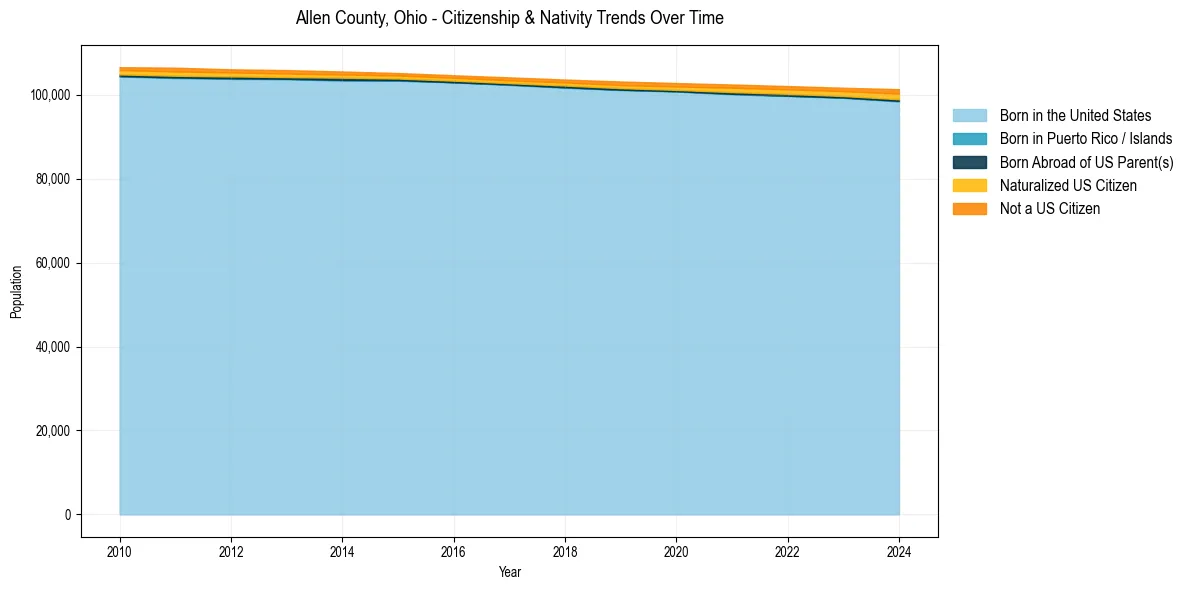
Allen County, Ohio Population & Nativity History
| Year | Total Pop | Foreign Born | Native Born |
|---|---|---|---|
| 2024 | 101,348 | 2.4% | 97.6% |
| 2023 | 101,685 | 1.9% | 98.1% |
| 2022 | 102,087 | 1.8% | 98.2% |
| 2021 | 102,462 | 1.8% | 98.2% |
| 2020 | 102,808 | 1.6% | 98.4% |
| 2019 | 103,175 | 1.5% | 98.5% |
| 2018 | 103,642 | 1.4% | 98.6% |
| 2017 | 104,157 | 1.3% | 98.7% |
| 2016 | 104,664 | 1.2% | 98.8% |
| 2015 | 105,196 | 1.2% | 98.8% |
| 2014 | 105,562 | 1.4% | 98.6% |
| 2013 | 105,895 | 1.6% | 98.4% |
| 2012 | 106,079 | 1.6% | 98.4% |
| 2011 | 106,468 | 1.8% | 98.2% |
| 2010 | 106,586 | 1.6% | 98.4% |
Nativity & Citizenship FAQs for Allen County, Ohio
Approximately 2.4% of residents in Allen County, Ohio were born outside the United States.
The vast majority of residents, roughly 98.9%, are U.S. citizens (including both native-born and naturalized citizens).