Ulster County, New York Nativity & Citizenship Status (2024)
Place of birth and citizenship status analysis for Ulster County, New York
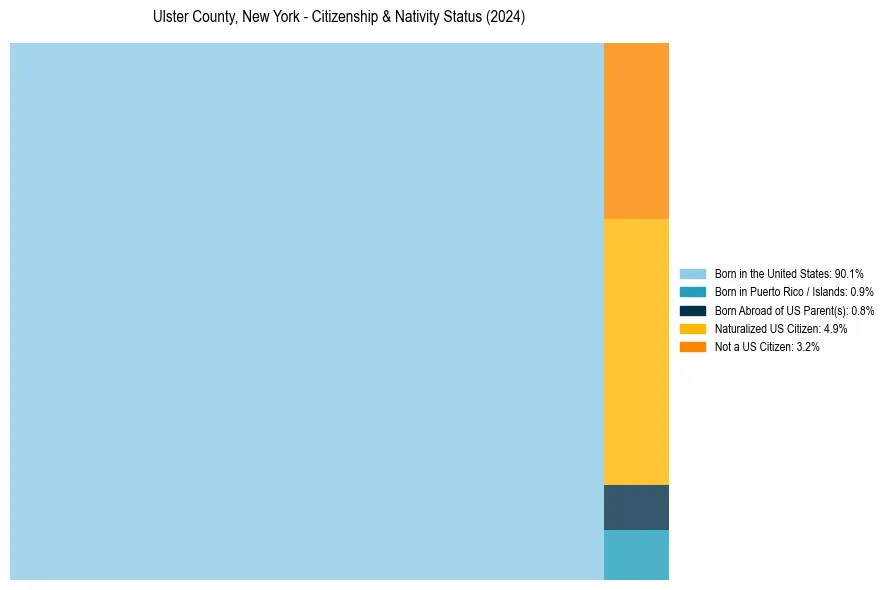
Ulster County, New York Nativity & Citizenship Indicators (2024)
Native Born
91.9%
Foreign Born
8.1%
Naturalized
4.9%
US Citizens
96.8%
Ulster County, New York Nativity & Citizenship Distribution
Ulster County, New York Historical Nativity Trends (2010–2024)
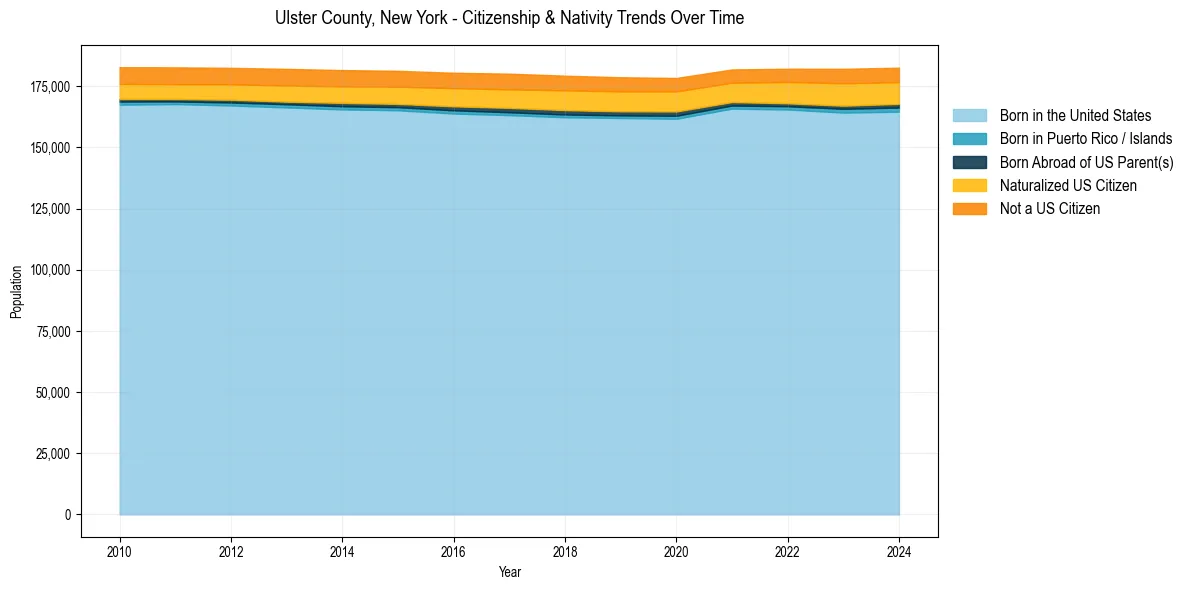
Ulster County, New York Population & Nativity History
| Year | Total Pop | Foreign Born | Native Born |
|---|---|---|---|
| 2024 | 182,601 | 8.1% | 91.9% |
| 2023 | 182,109 | 8.3% | 91.7% |
| 2022 | 182,153 | 7.8% | 92.2% |
| 2021 | 181,862 | 7.3% | 92.7% |
| 2020 | 178,371 | 7.7% | 92.3% |
| 2019 | 178,665 | 7.8% | 92.2% |
| 2018 | 179,303 | 7.8% | 92.2% |
| 2017 | 180,129 | 7.8% | 92.2% |
| 2016 | 180,505 | 7.6% | 92.4% |
| 2015 | 181,300 | 7.5% | 92.5% |
| 2014 | 181,598 | 7.4% | 92.6% |
| 2013 | 182,086 | 7.4% | 92.6% |
| 2012 | 182,516 | 7.1% | 92.9% |
| 2011 | 182,710 | 7.1% | 92.9% |
| 2010 | 182,782 | 7.1% | 92.9% |
Nativity & Citizenship FAQs for Ulster County, New York
Approximately 8.1% of residents in Ulster County, New York were born outside the United States.
The vast majority of residents, roughly 96.8%, are U.S. citizens (including both native-born and naturalized citizens).