Suffolk County, New York Nativity & Citizenship Status (2024)
Place of birth and citizenship status analysis for Suffolk County, New York
Suffolk County, New York Nativity & Citizenship Indicators (2024)
Native Born
83.2%
Foreign Born
16.8%
Naturalized
9.9%
US Citizens
93.1%
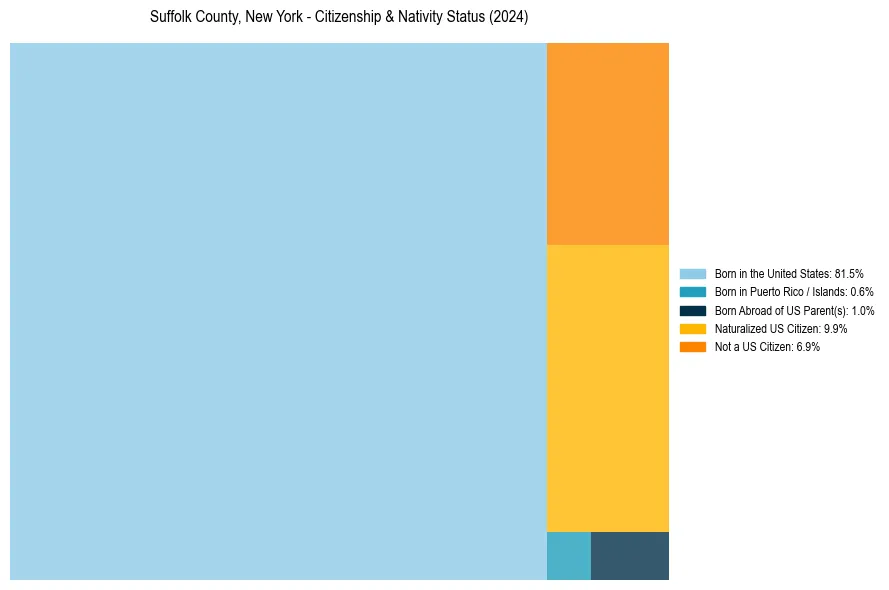
Suffolk County, New York Nativity & Citizenship Distribution
Suffolk County, New York Historical Nativity Trends (2010–2024)
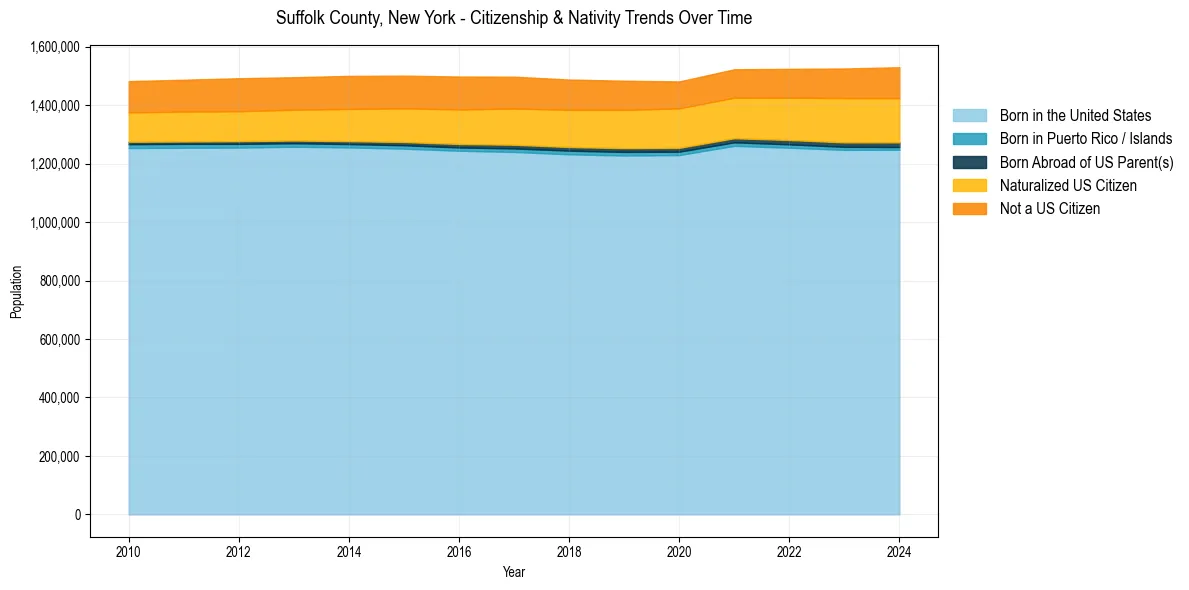
Suffolk County, New York Population & Nativity History
| Year | Total Pop | Foreign Born | Native Born |
|---|---|---|---|
| 2024 | 1,530,146 | 16.8% | 83.2% |
| 2023 | 1,525,680 | 16.6% | 83.4% |
| 2022 | 1,524,486 | 16.0% | 84.0% |
| 2021 | 1,522,998 | 15.5% | 84.5% |
| 2020 | 1,481,364 | 15.3% | 84.7% |
| 2019 | 1,483,832 | 15.6% | 84.4% |
| 2018 | 1,487,901 | 15.5% | 84.5% |
| 2017 | 1,497,595 | 15.6% | 84.4% |
| 2016 | 1,498,130 | 15.4% | 84.6% |
| 2015 | 1,501,373 | 15.1% | 84.9% |
| 2014 | 1,500,373 | 14.9% | 85.1% |
| 2013 | 1,495,803 | 14.5% | 85.5% |
| 2012 | 1,492,360 | 14.4% | 85.6% |
| 2011 | 1,487,177 | 14.2% | 85.8% |
| 2010 | 1,482,548 | 14.0% | 86.0% |
Nativity & Citizenship FAQs for Suffolk County, New York
Approximately 16.8% of residents in Suffolk County, New York were born outside the United States.
The vast majority of residents, roughly 93.1%, are U.S. citizens (including both native-born and naturalized citizens).