Rockland County, New York Nativity & Citizenship Status (2024)
Place of birth and citizenship status analysis for Rockland County, New York
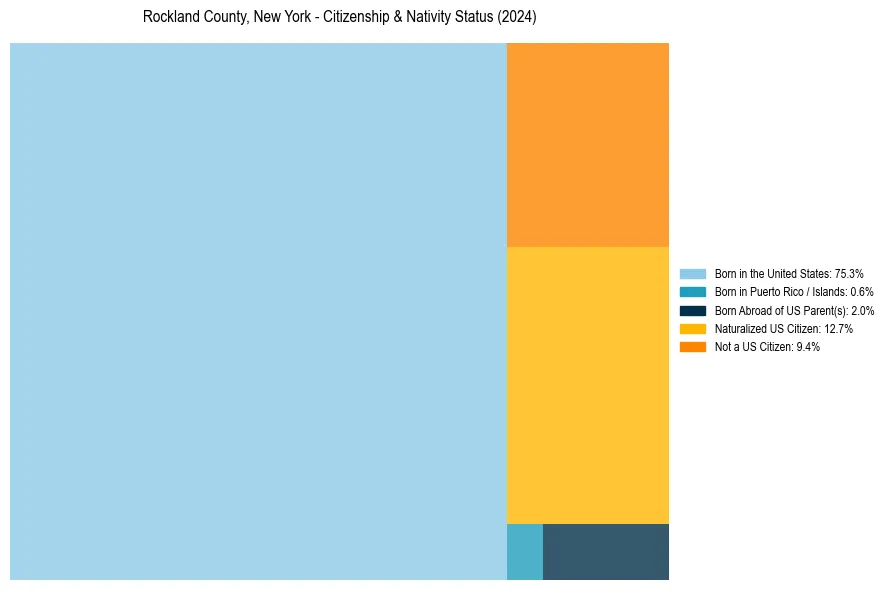
Rockland County, New York Nativity & Citizenship Indicators (2024)
Native Born
77.9%
Foreign Born
22.1%
Naturalized
12.7%
US Citizens
90.6%
Rockland County, New York Nativity & Citizenship Distribution
Rockland County, New York Historical Nativity Trends (2010–2024)
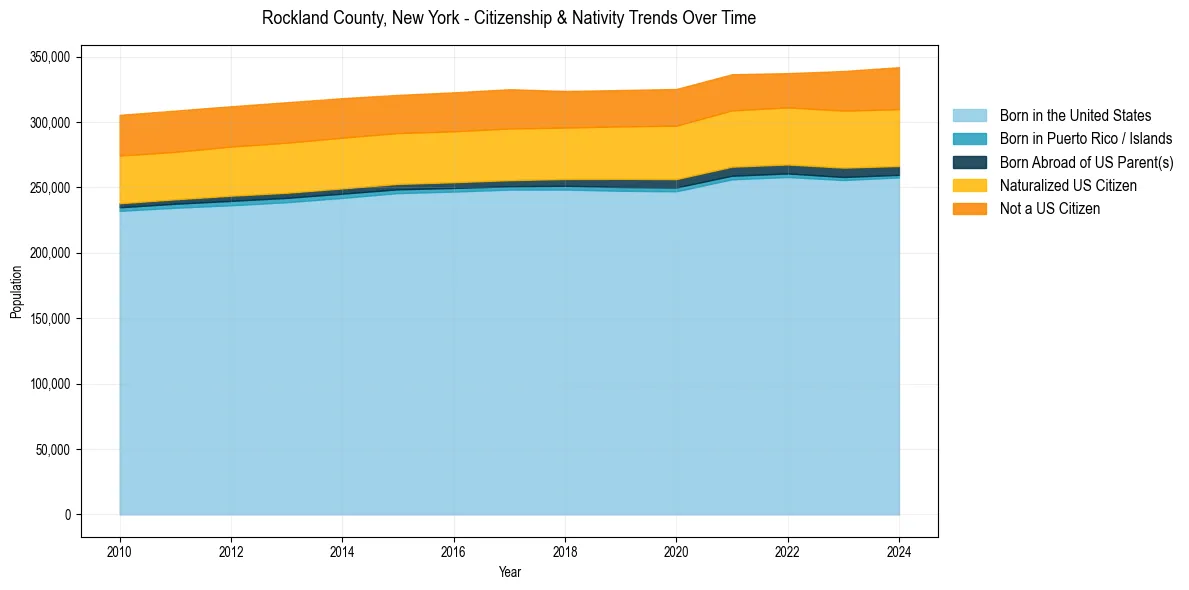
Rockland County, New York Population & Nativity History
| Year | Total Pop | Foreign Born | Native Born |
|---|---|---|---|
| 2024 | 341,883 | 22.1% | 77.9% |
| 2023 | 338,936 | 21.8% | 78.2% |
| 2022 | 337,326 | 20.7% | 79.3% |
| 2021 | 336,485 | 21.0% | 79.0% |
| 2020 | 325,213 | 21.2% | 78.8% |
| 2019 | 324,422 | 20.9% | 79.1% |
| 2018 | 323,686 | 20.8% | 79.2% |
| 2017 | 325,027 | 21.4% | 78.6% |
| 2016 | 322,642 | 21.3% | 78.7% |
| 2015 | 320,688 | 21.2% | 78.8% |
| 2014 | 318,186 | 21.7% | 78.3% |
| 2013 | 315,069 | 22.0% | 78.0% |
| 2012 | 312,011 | 21.9% | 78.1% |
| 2011 | 308,682 | 22.0% | 78.0% |
| 2010 | 305,461 | 22.1% | 77.9% |
Nativity & Citizenship FAQs for Rockland County, New York
Approximately 22.1% of residents in Rockland County, New York were born outside the United States.
The vast majority of residents, roughly 90.6%, are U.S. citizens (including both native-born and naturalized citizens).