Queens County, New York Nativity & Citizenship Status (2024)
Place of birth and citizenship status analysis for Queens County, New York
Queens County, New York Nativity & Citizenship Indicators (2024)
Native Born
52.4%
Foreign Born
47.6%
Naturalized
28.2%
US Citizens
80.7%
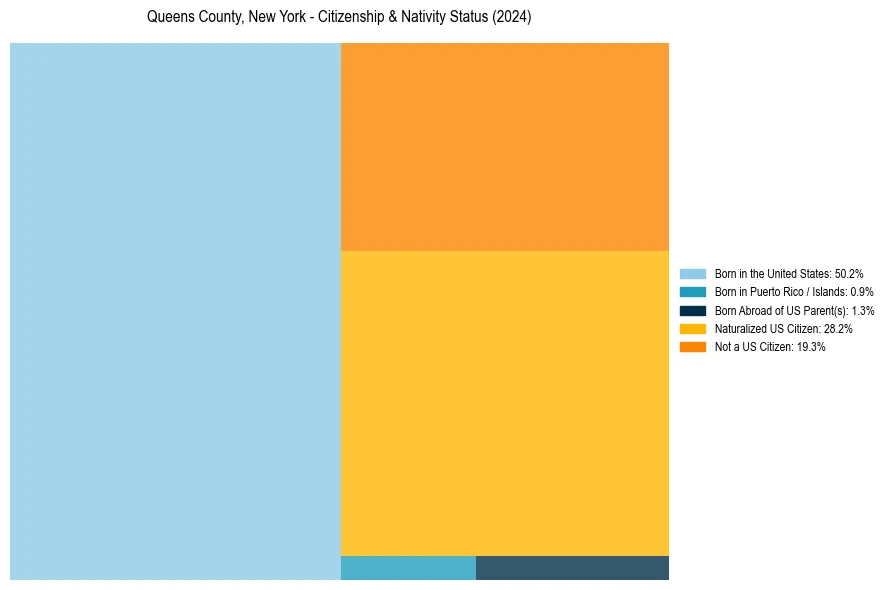
Queens County, New York Nativity & Citizenship Distribution
Queens County, New York Historical Nativity Trends (2010–2024)
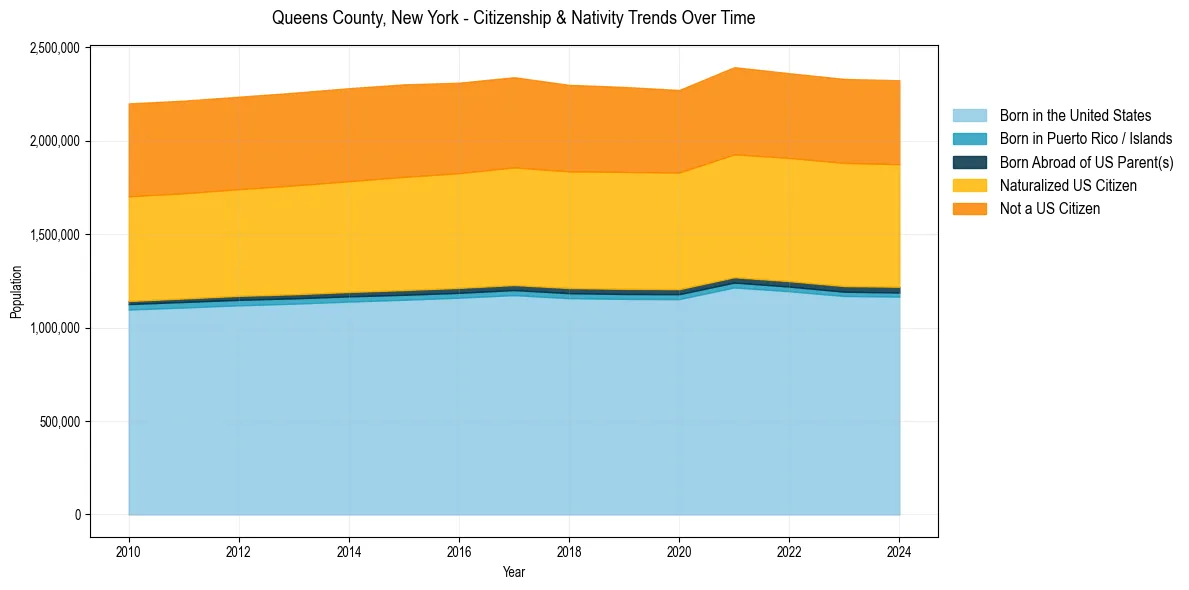
Queens County, New York Population & Nativity History
| Year | Total Pop | Foreign Born | Native Born |
|---|---|---|---|
| 2024 | 2,323,052 | 47.6% | 52.4% |
| 2023 | 2,330,124 | 47.6% | 52.4% |
| 2022 | 2,360,826 | 47.1% | 52.9% |
| 2021 | 2,393,104 | 47.0% | 53.0% |
| 2020 | 2,270,976 | 46.9% | 53.1% |
| 2019 | 2,287,388 | 47.2% | 52.8% |
| 2018 | 2,298,513 | 47.3% | 52.7% |
| 2017 | 2,339,280 | 47.5% | 52.5% |
| 2016 | 2,310,011 | 47.5% | 52.5% |
| 2015 | 2,301,139 | 47.8% | 52.2% |
| 2014 | 2,280,602 | 47.8% | 52.2% |
| 2013 | 2,256,400 | 47.8% | 52.2% |
| 2012 | 2,235,008 | 47.7% | 52.3% |
| 2011 | 2,213,977 | 47.8% | 52.2% |
| 2010 | 2,199,169 | 48.1% | 51.9% |
Nativity & Citizenship FAQs for Queens County, New York
Approximately 47.6% of residents in Queens County, New York were born outside the United States.
The vast majority of residents, roughly 80.7%, are U.S. citizens (including both native-born and naturalized citizens).