Onondaga County, New York Nativity & Citizenship Status (2024)
Place of birth and citizenship status analysis for Onondaga County, New York
Onondaga County, New York Nativity & Citizenship Indicators (2024)
Native Born
92.1%
Foreign Born
7.9%
Naturalized
4.4%
US Citizens
96.5%
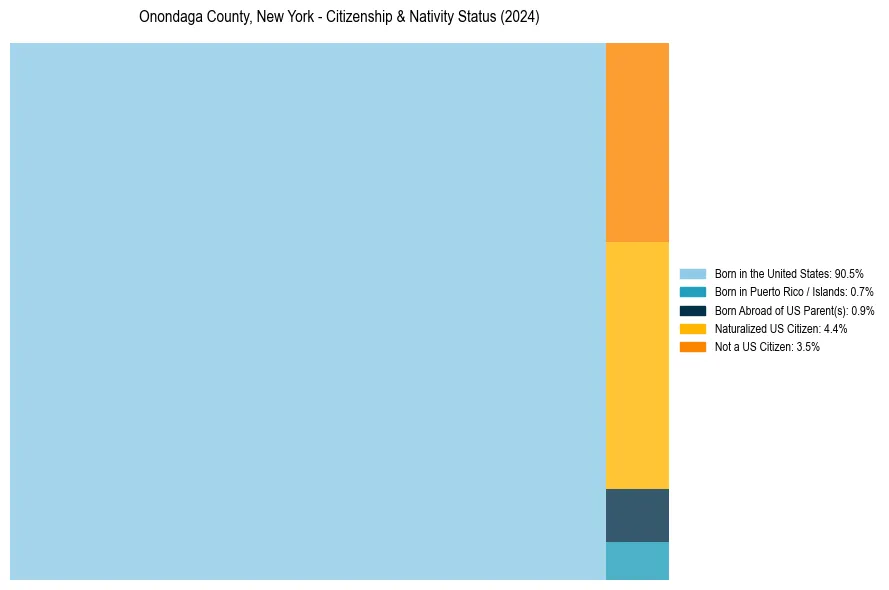
Onondaga County, New York Nativity & Citizenship Distribution
Onondaga County, New York Historical Nativity Trends (2010–2024)
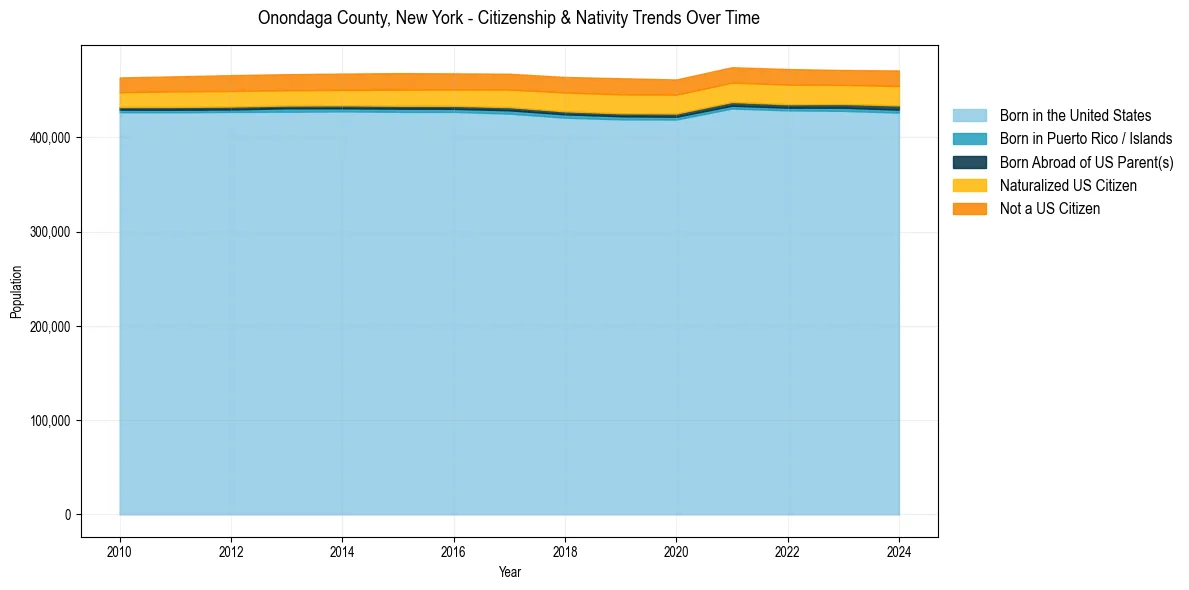
Onondaga County, New York Population & Nativity History
| Year | Total Pop | Foreign Born | Native Born |
|---|---|---|---|
| 2024 | 471,129 | 7.9% | 92.1% |
| 2023 | 471,611 | 7.6% | 92.4% |
| 2022 | 472,637 | 7.9% | 92.1% |
| 2021 | 474,621 | 7.8% | 92.2% |
| 2020 | 461,591 | 7.8% | 92.2% |
| 2019 | 462,872 | 8.0% | 92.0% |
| 2018 | 464,242 | 7.9% | 92.1% |
| 2017 | 467,669 | 7.6% | 92.4% |
| 2016 | 468,050 | 7.4% | 92.6% |
| 2015 | 468,304 | 7.4% | 92.6% |
| 2014 | 467,846 | 7.2% | 92.8% |
| 2013 | 467,202 | 7.1% | 92.9% |
| 2012 | 466,179 | 7.2% | 92.8% |
| 2011 | 464,921 | 7.0% | 93.0% |
| 2010 | 463,704 | 6.8% | 93.2% |
Nativity & Citizenship FAQs for Onondaga County, New York
Approximately 7.9% of residents in Onondaga County, New York were born outside the United States.
The vast majority of residents, roughly 96.5%, are U.S. citizens (including both native-born and naturalized citizens).