New York County, New York Nativity & Citizenship Status (2024)
Place of birth and citizenship status analysis for New York County, New York
New York County, New York Nativity & Citizenship Indicators (2024)
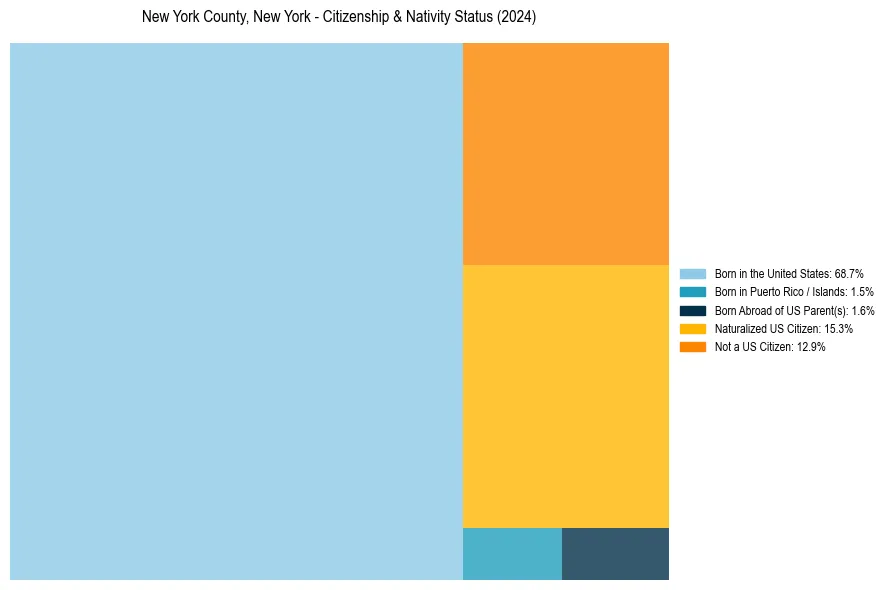
Native Born
71.8%
Foreign Born
28.2%
Naturalized
15.3%
US Citizens
87.1%
New York County, New York Nativity & Citizenship Distribution
New York County, New York Historical Nativity Trends (2010–2024)
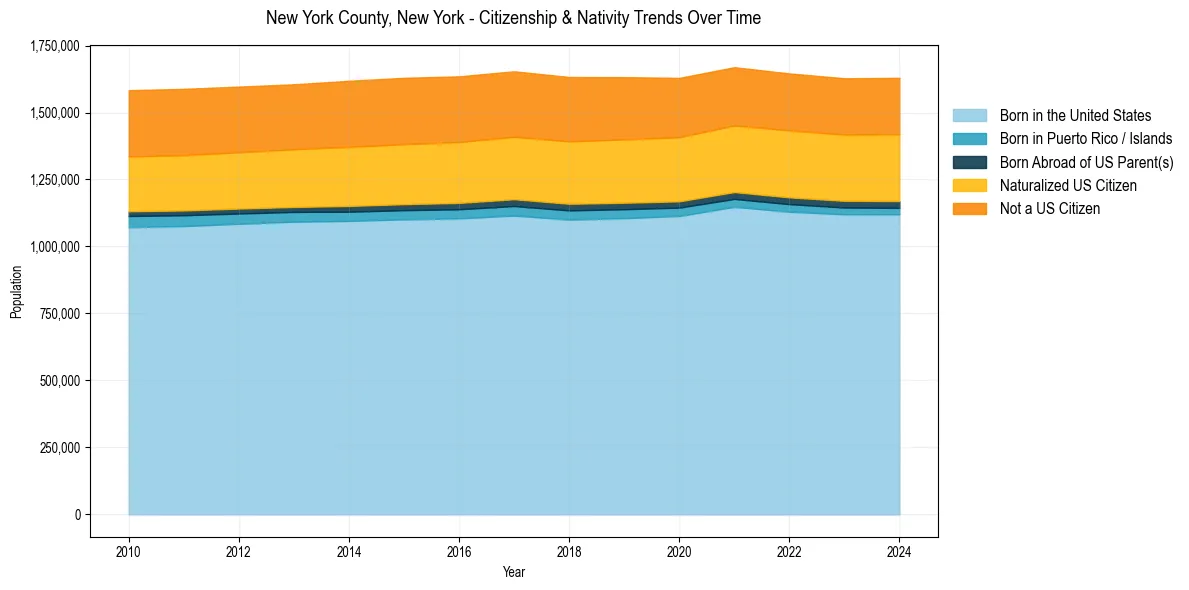
New York County, New York Population & Nativity History
| Year | Total Pop | Foreign Born | Native Born |
|---|---|---|---|
| 2024 | 1,629,477 | 28.2% | 71.8% |
| 2023 | 1,627,788 | 28.1% | 71.9% |
| 2022 | 1,645,867 | 28.1% | 71.9% |
| 2021 | 1,669,127 | 27.9% | 72.1% |
| 2020 | 1,629,153 | 28.3% | 71.7% |
| 2019 | 1,631,993 | 28.7% | 71.3% |
| 2018 | 1,632,480 | 29.0% | 71.0% |
| 2017 | 1,653,877 | 28.9% | 71.1% |
| 2016 | 1,634,989 | 28.9% | 71.1% |
| 2015 | 1,629,507 | 28.9% | 71.1% |
| 2014 | 1,618,398 | 28.9% | 71.1% |
| 2013 | 1,605,272 | 28.5% | 71.5% |
| 2012 | 1,596,735 | 28.5% | 71.5% |
| 2011 | 1,588,257 | 28.6% | 71.4% |
| 2010 | 1,583,345 | 28.6% | 71.4% |
Nativity & Citizenship FAQs for New York County, New York
Approximately 28.2% of residents in New York County, New York were born outside the United States.
The vast majority of residents, roughly 87.1%, are U.S. citizens (including both native-born and naturalized citizens).