Dutchess County, New York Nativity & Citizenship Status (2024)
Place of birth and citizenship status analysis for Dutchess County, New York
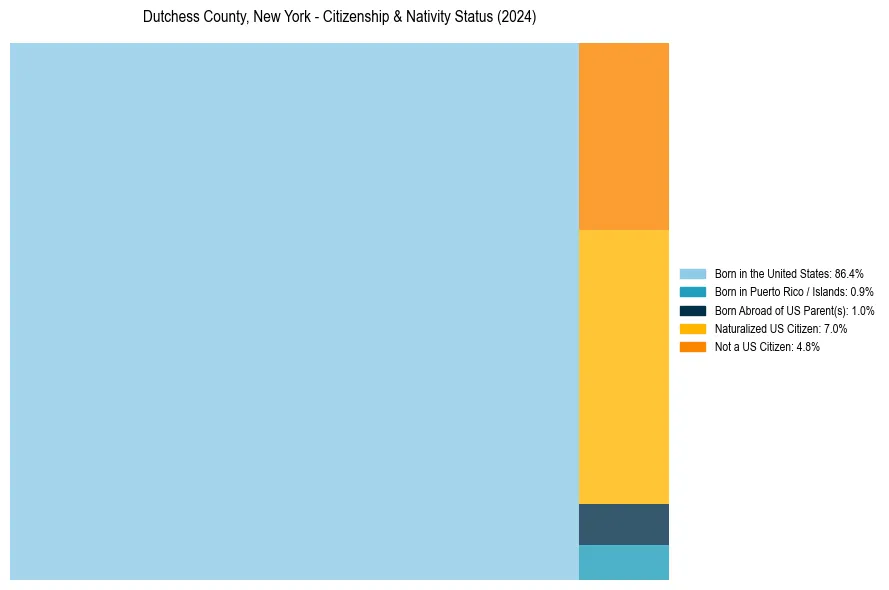
Dutchess County, New York Nativity & Citizenship Indicators (2024)
Native Born
88.3%
Foreign Born
11.7%
Naturalized
7.0%
US Citizens
95.2%
Dutchess County, New York Nativity & Citizenship Distribution
Dutchess County, New York Historical Nativity Trends (2010–2024)
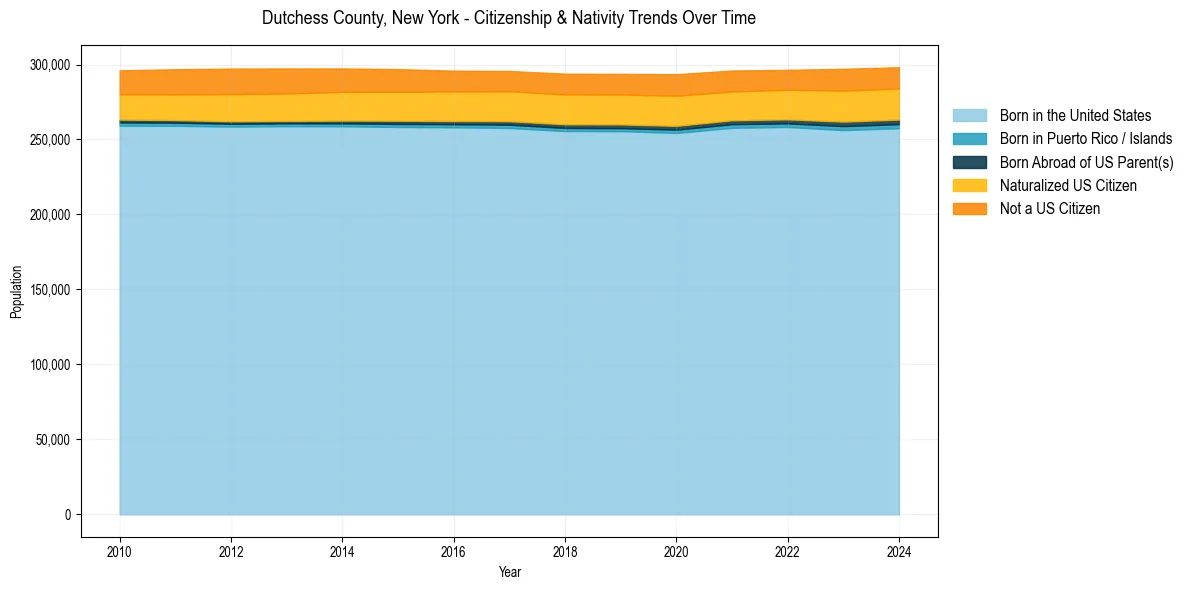
Dutchess County, New York Population & Nativity History
| Year | Total Pop | Foreign Born | Native Born |
|---|---|---|---|
| 2024 | 298,220 | 11.7% | 88.3% |
| 2023 | 297,144 | 11.9% | 88.1% |
| 2022 | 296,467 | 11.1% | 88.9% |
| 2021 | 296,012 | 11.2% | 88.8% |
| 2020 | 293,524 | 11.7% | 88.3% |
| 2019 | 293,754 | 11.5% | 88.5% |
| 2018 | 293,894 | 11.5% | 88.5% |
| 2017 | 295,685 | 11.3% | 88.7% |
| 2016 | 295,905 | 11.4% | 88.6% |
| 2015 | 296,928 | 11.6% | 88.4% |
| 2014 | 297,388 | 11.7% | 88.3% |
| 2013 | 297,385 | 11.8% | 88.2% |
| 2012 | 297,291 | 11.8% | 88.2% |
| 2011 | 296,842 | 11.4% | 88.6% |
| 2010 | 296,152 | 11.1% | 88.9% |
Nativity & Citizenship FAQs for Dutchess County, New York
Approximately 11.7% of residents in Dutchess County, New York were born outside the United States.
The vast majority of residents, roughly 95.2%, are U.S. citizens (including both native-born and naturalized citizens).