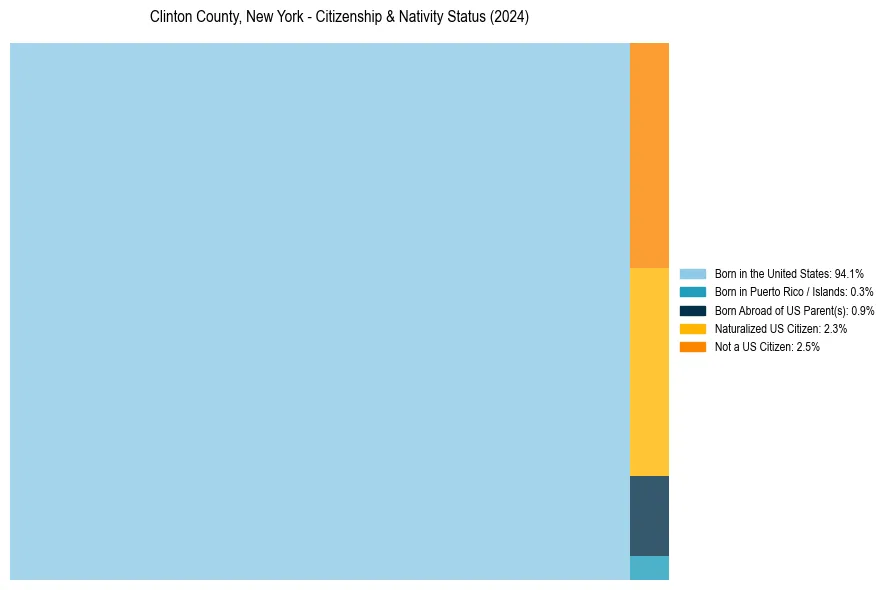
Clinton County, New York Nativity & Citizenship Status (2024)
Place of birth and citizenship status analysis for Clinton County, New York
Clinton County, New York Nativity & Citizenship Indicators (2024)
Native Born
95.2%
Foreign Born
4.8%
Naturalized
2.3%
US Citizens
97.5%
Clinton County, New York Nativity & Citizenship Distribution
Clinton County, New York Historical Nativity Trends (2010–2024)
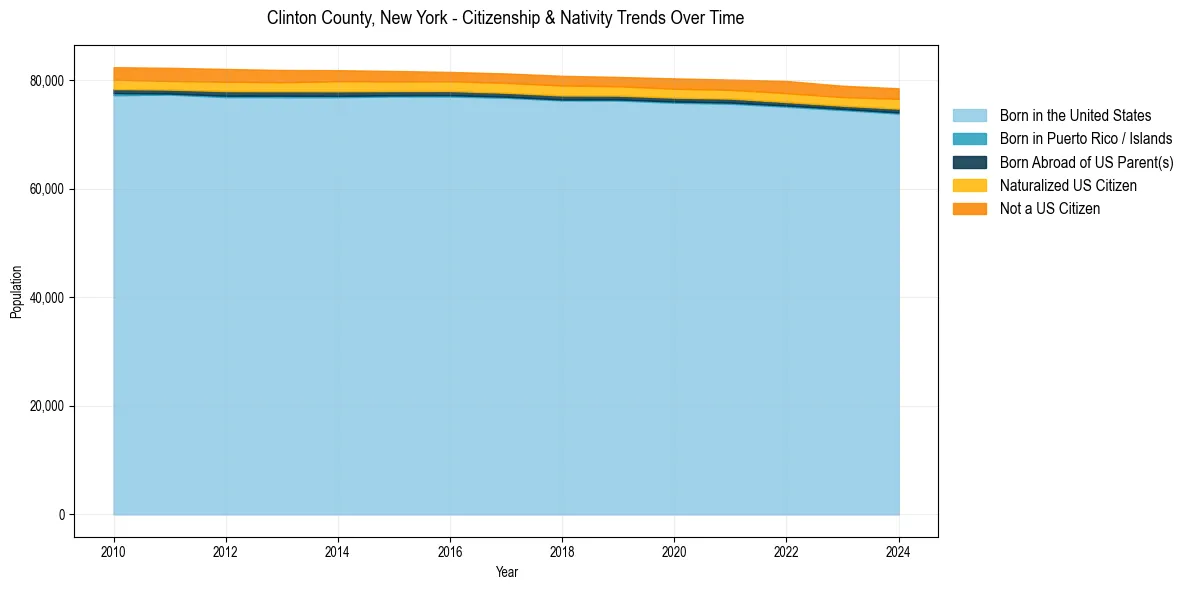
Clinton County, New York Population & Nativity History
| Year | Total Pop | Foreign Born | Native Born |
|---|---|---|---|
| 2024 | 78,493 | 4.8% | 95.2% |
| 2023 | 78,961 | 4.7% | 95.3% |
| 2022 | 79,839 | 4.9% | 95.1% |
| 2021 | 80,095 | 4.4% | 95.6% |
| 2020 | 80,320 | 4.4% | 95.6% |
| 2019 | 80,583 | 4.3% | 95.7% |
| 2018 | 80,794 | 4.5% | 95.5% |
| 2017 | 81,224 | 4.4% | 95.6% |
| 2016 | 81,505 | 4.3% | 95.7% |
| 2015 | 81,685 | 4.5% | 95.5% |
| 2014 | 81,829 | 4.8% | 95.2% |
| 2013 | 81,865 | 4.8% | 95.2% |
| 2012 | 82,054 | 5.0% | 95.0% |
| 2011 | 82,265 | 4.9% | 95.1% |
| 2010 | 82,380 | 4.9% | 95.1% |
Nativity & Citizenship FAQs for Clinton County, New York
Approximately 4.8% of residents in Clinton County, New York were born outside the United States.
The vast majority of residents, roughly 97.5%, are U.S. citizens (including both native-born and naturalized citizens).