Cayuga County, New York Nativity & Citizenship Status (2024)
Place of birth and citizenship status analysis for Cayuga County, New York
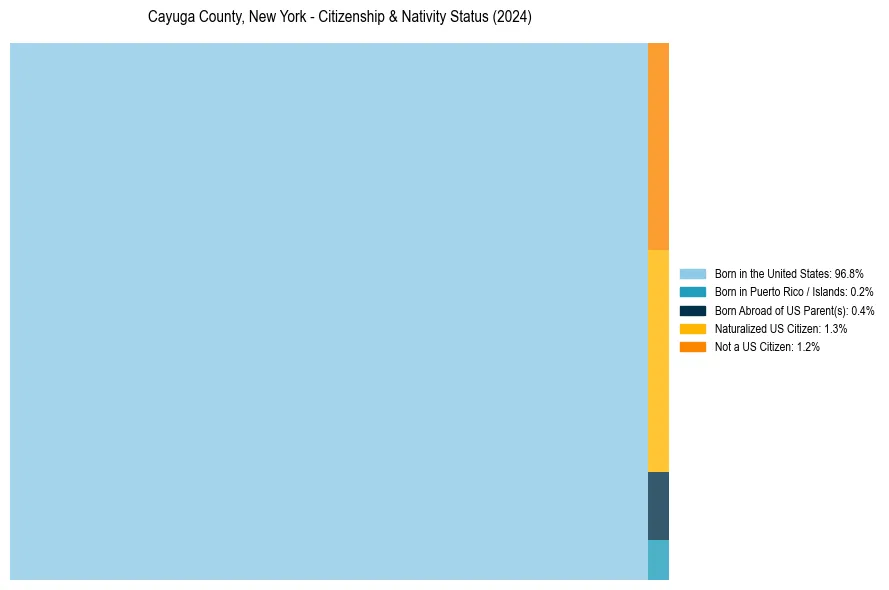
Cayuga County, New York Nativity & Citizenship Indicators (2024)
Native Born
97.4%
Foreign Born
2.6%
Naturalized
1.3%
US Citizens
98.8%
Cayuga County, New York Nativity & Citizenship Distribution
Cayuga County, New York Historical Nativity Trends (2010–2024)
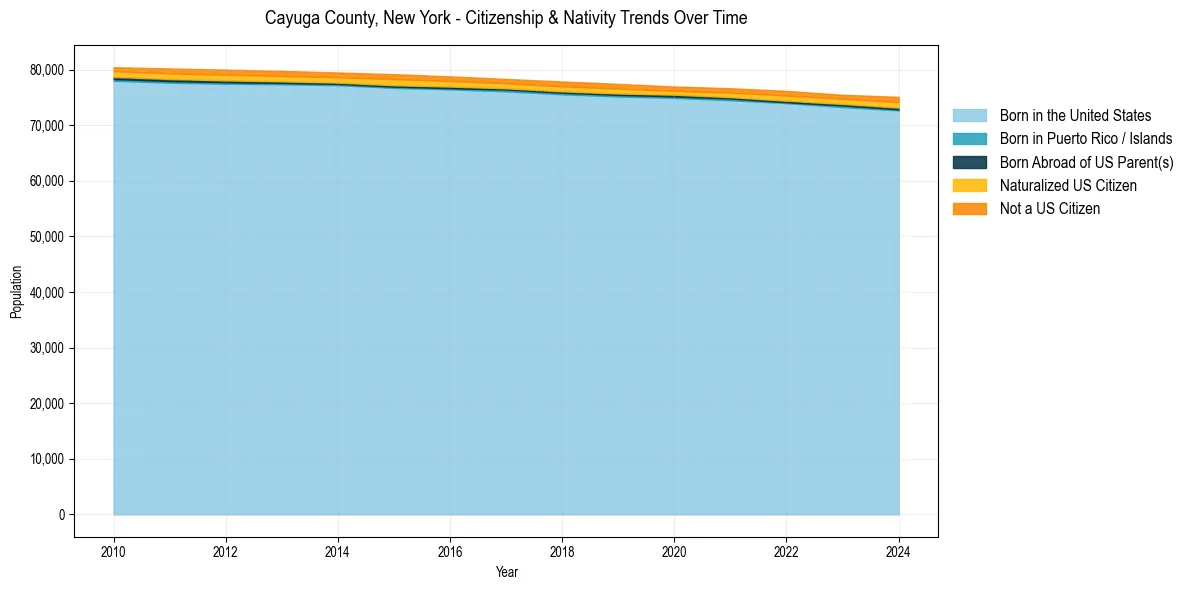
Cayuga County, New York Population & Nativity History
| Year | Total Pop | Foreign Born | Native Born |
|---|---|---|---|
| 2024 | 75,102 | 2.6% | 97.4% |
| 2023 | 75,464 | 2.2% | 97.8% |
| 2022 | 76,171 | 2.3% | 97.7% |
| 2021 | 76,644 | 2.1% | 97.9% |
| 2020 | 76,958 | 1.9% | 98.1% |
| 2019 | 77,425 | 2.2% | 97.8% |
| 2018 | 77,868 | 2.3% | 97.7% |
| 2017 | 78,319 | 2.2% | 97.8% |
| 2016 | 78,783 | 2.3% | 97.7% |
| 2015 | 79,173 | 2.5% | 97.5% |
| 2014 | 79,481 | 2.3% | 97.7% |
| 2013 | 79,767 | 2.4% | 97.6% |
| 2012 | 79,996 | 2.4% | 97.6% |
| 2011 | 80,204 | 2.4% | 97.6% |
| 2010 | 80,431 | 2.2% | 97.8% |
Nativity & Citizenship FAQs for Cayuga County, New York
Approximately 2.6% of residents in Cayuga County, New York were born outside the United States.
The vast majority of residents, roughly 98.8%, are U.S. citizens (including both native-born and naturalized citizens).