Bronx County, New York Nativity & Citizenship Status (2024)
Place of birth and citizenship status analysis for Bronx County, New York
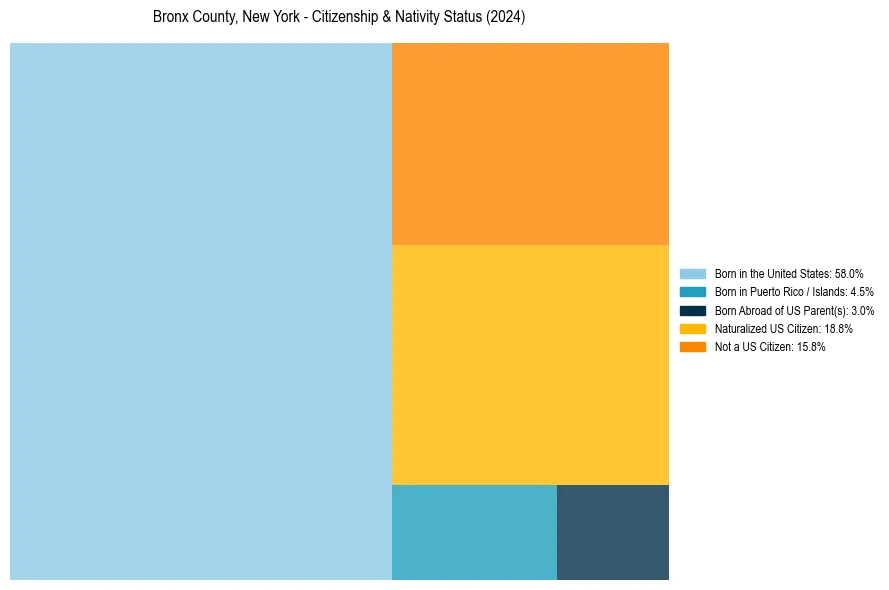
Bronx County, New York Nativity & Citizenship Indicators (2024)
Native Born
65.4%
Foreign Born
34.6%
Naturalized
18.8%
US Citizens
84.2%
Bronx County, New York Nativity & Citizenship Distribution
Bronx County, New York Historical Nativity Trends (2010–2024)
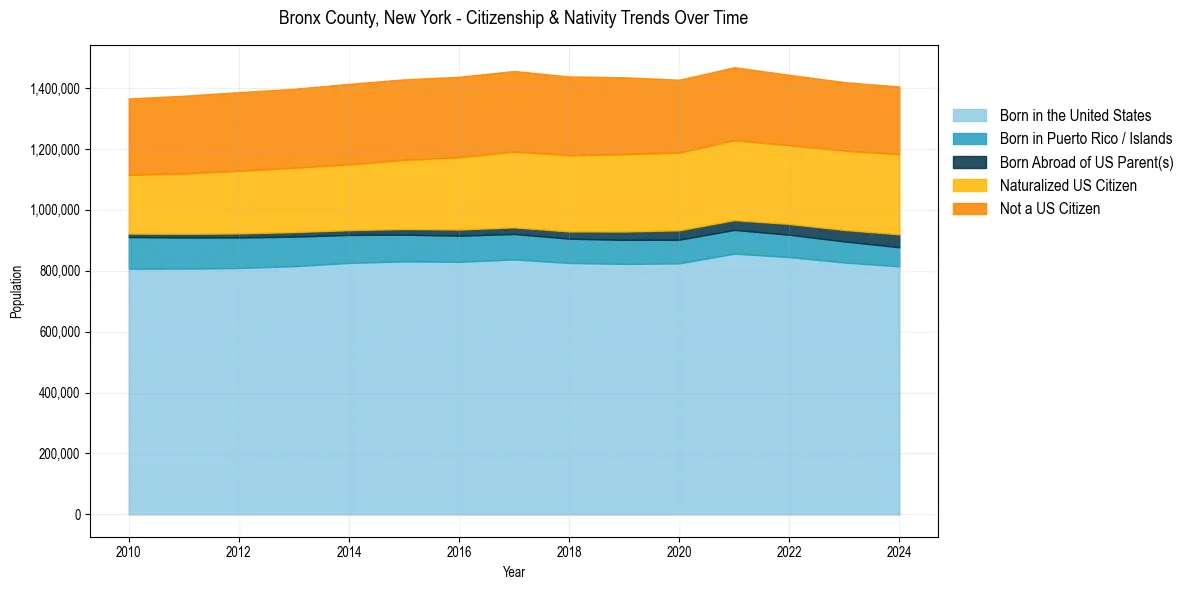
Bronx County, New York Population & Nativity History
| Year | Total Pop | Foreign Born | Native Born |
|---|---|---|---|
| 2024 | 1,404,779 | 34.6% | 65.4% |
| 2023 | 1,419,250 | 34.2% | 65.8% |
| 2022 | 1,443,229 | 33.9% | 66.1% |
| 2021 | 1,468,262 | 34.2% | 65.8% |
| 2020 | 1,427,056 | 34.6% | 65.4% |
| 2019 | 1,435,068 | 35.3% | 64.7% |
| 2018 | 1,437,872 | 35.4% | 64.6% |
| 2017 | 1,455,846 | 35.3% | 64.7% |
| 2016 | 1,436,785 | 34.9% | 65.1% |
| 2015 | 1,428,357 | 34.4% | 65.6% |
| 2014 | 1,413,566 | 34.0% | 66.0% |
| 2013 | 1,397,315 | 33.7% | 66.3% |
| 2012 | 1,386,364 | 33.5% | 66.5% |
| 2011 | 1,374,593 | 33.0% | 67.0% |
| 2010 | 1,365,725 | 32.5% | 67.5% |
Nativity & Citizenship FAQs for Bronx County, New York
Approximately 34.6% of residents in Bronx County, New York were born outside the United States.
The vast majority of residents, roughly 84.2%, are U.S. citizens (including both native-born and naturalized citizens).