Albany County, New York Nativity & Citizenship Status (2024)
Place of birth and citizenship status analysis for Albany County, New York
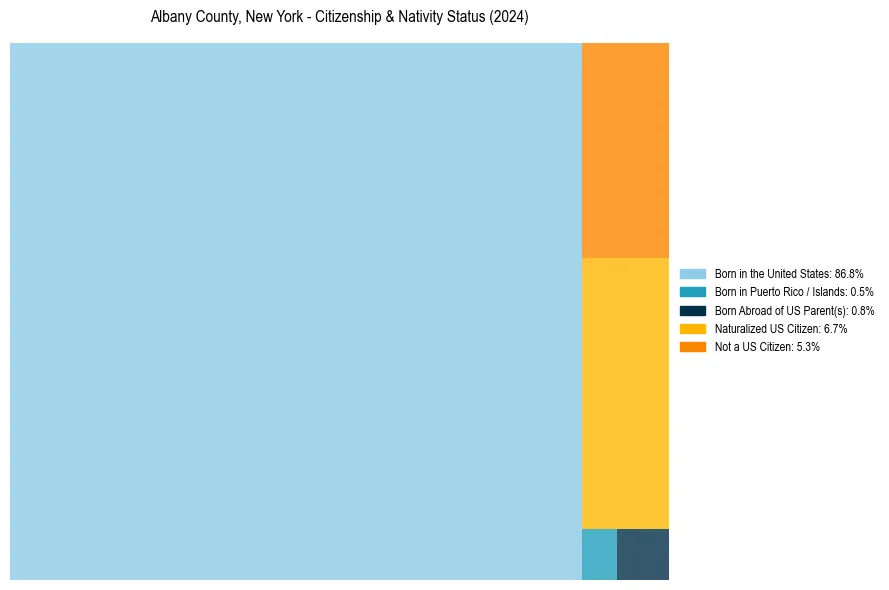
Albany County, New York Nativity & Citizenship Indicators (2024)
Native Born
88.0%
Foreign Born
12.0%
Naturalized
6.7%
US Citizens
94.7%
Albany County, New York Nativity & Citizenship Distribution
Albany County, New York Historical Nativity Trends (2010–2024)
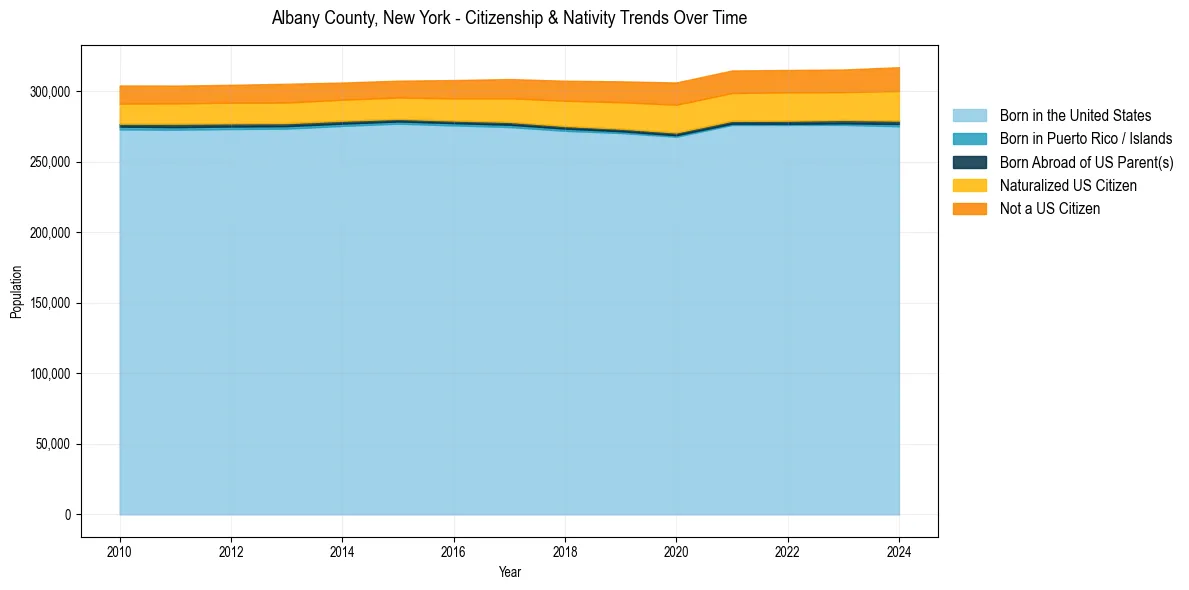
Albany County, New York Population & Nativity History
| Year | Total Pop | Foreign Born | Native Born |
|---|---|---|---|
| 2024 | 317,018 | 12.0% | 88.0% |
| 2023 | 315,374 | 11.3% | 88.7% |
| 2022 | 315,041 | 11.4% | 88.6% |
| 2021 | 314,679 | 11.3% | 88.7% |
| 2020 | 306,165 | 11.6% | 88.4% |
| 2019 | 306,968 | 10.9% | 89.1% |
| 2018 | 307,426 | 10.4% | 89.6% |
| 2017 | 308,580 | 9.8% | 90.2% |
| 2016 | 307,891 | 9.3% | 90.7% |
| 2015 | 307,463 | 8.8% | 91.2% |
| 2014 | 306,124 | 8.8% | 91.2% |
| 2013 | 305,279 | 9.1% | 90.9% |
| 2012 | 304,511 | 9.0% | 91.0% |
| 2011 | 303,957 | 8.9% | 91.1% |
| 2010 | 304,032 | 8.9% | 91.1% |
Nativity & Citizenship FAQs for Albany County, New York
Approximately 12.0% of residents in Albany County, New York were born outside the United States.
The vast majority of residents, roughly 94.7%, are U.S. citizens (including both native-born and naturalized citizens).