New Mexico Nativity & Citizenship Status (2024)
Place of birth and citizenship status analysis for New Mexico
New Mexico Nativity & Citizenship Indicators (2024)
Native Born
90.6%
Foreign Born
9.4%
Naturalized
4.1%
US Citizens
94.7%
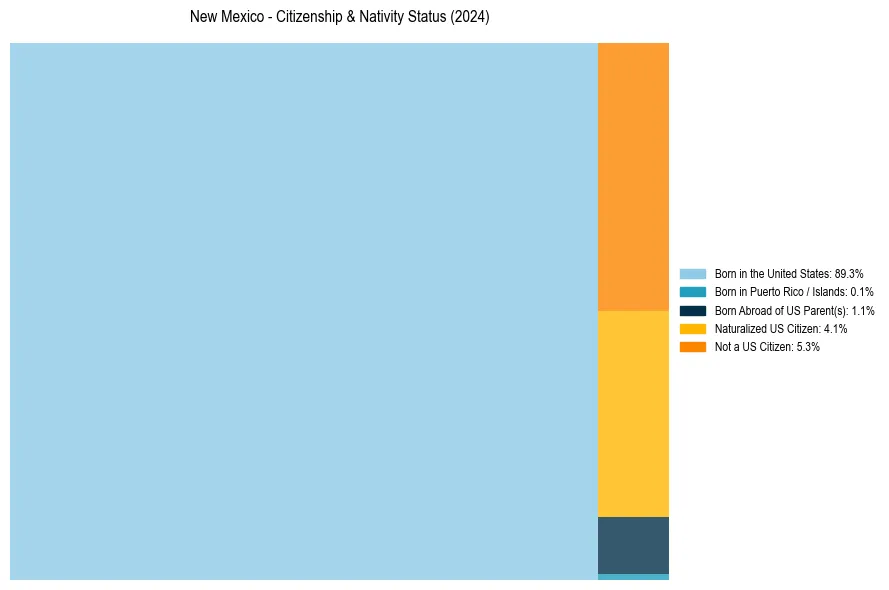
New Mexico Nativity & Citizenship Distribution
New Mexico Historical Nativity Trends (2010–2024)
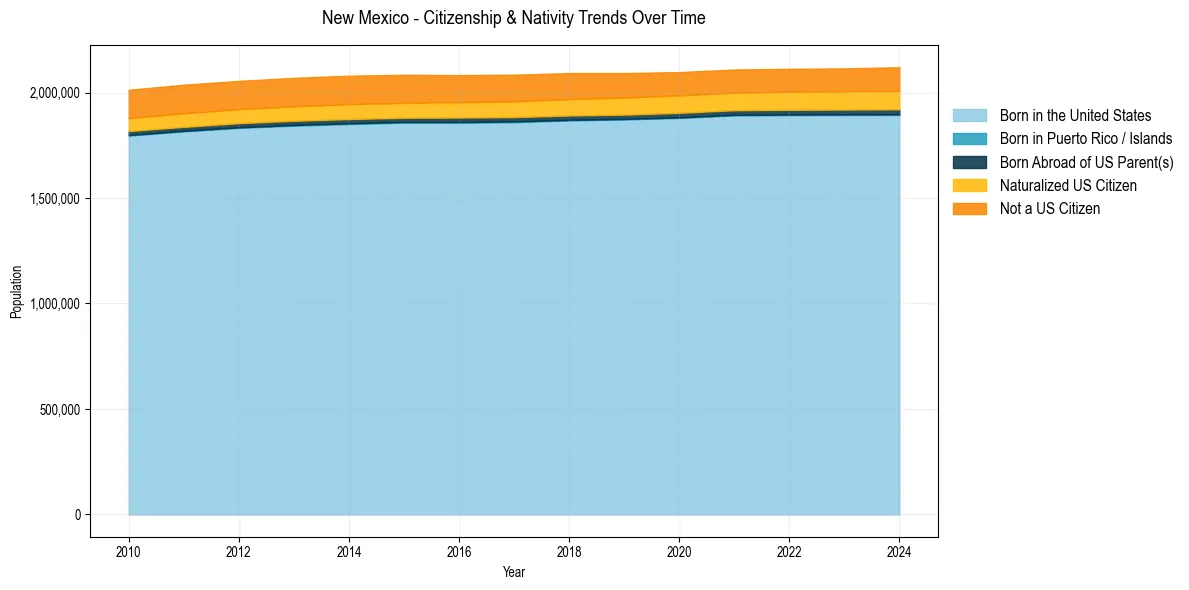
New Mexico Population & Nativity History
| Year | Total Pop | Foreign Born | Native Born |
|---|---|---|---|
| 2024 | 2,120,246 | 9.4% | 90.6% |
| 2023 | 2,114,768 | 9.2% | 90.8% |
| 2022 | 2,112,463 | 9.2% | 90.8% |
| 2021 | 2,109,366 | 9.2% | 90.8% |
| 2020 | 2,097,021 | 9.2% | 90.8% |
| 2019 | 2,092,454 | 9.4% | 90.6% |
| 2018 | 2,092,434 | 9.6% | 90.4% |
| 2017 | 2,084,828 | 9.7% | 90.3% |
| 2016 | 2,082,669 | 9.7% | 90.3% |
| 2015 | 2,084,117 | 9.8% | 90.2% |
| 2014 | 2,080,085 | 9.9% | 90.1% |
| 2013 | 2,069,706 | 9.8% | 90.2% |
| 2012 | 2,055,287 | 9.8% | 90.2% |
| 2011 | 2,037,136 | 9.8% | 90.2% |
| 2010 | 2,013,122 | 9.7% | 90.3% |
Nativity & Citizenship FAQs for New Mexico
Approximately 9.4% of residents in New Mexico were born outside the United States.
The vast majority of residents, roughly 94.7%, are U.S. citizens (including both native-born and naturalized citizens).