Warren County, New Jersey Nativity & Citizenship Status (2024)
Place of birth and citizenship status analysis for Warren County, New Jersey
Warren County, New Jersey Nativity & Citizenship Indicators (2024)
Native Born
89.4%
Foreign Born
10.6%
Naturalized
6.9%
US Citizens
96.3%
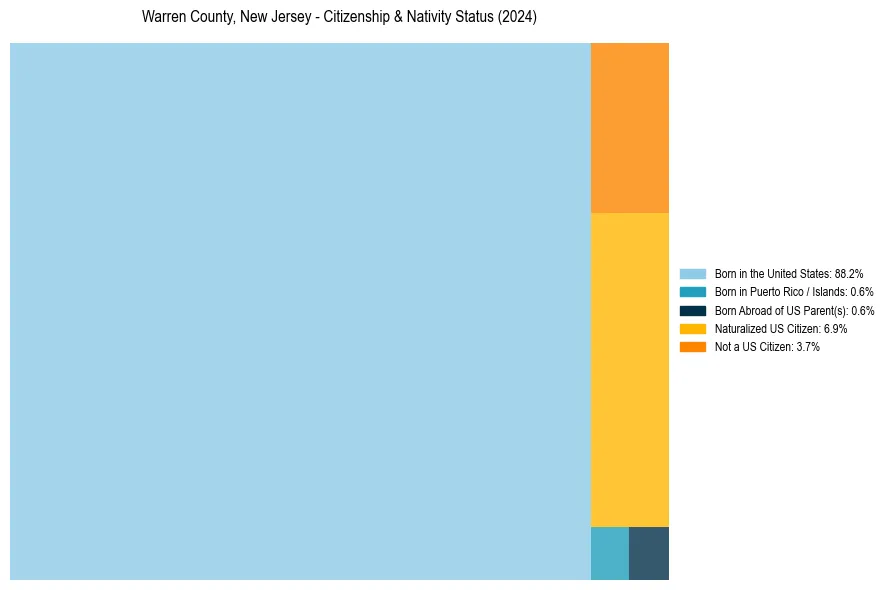
Warren County, New Jersey Nativity & Citizenship Distribution
Warren County, New Jersey Historical Nativity Trends (2010–2024)
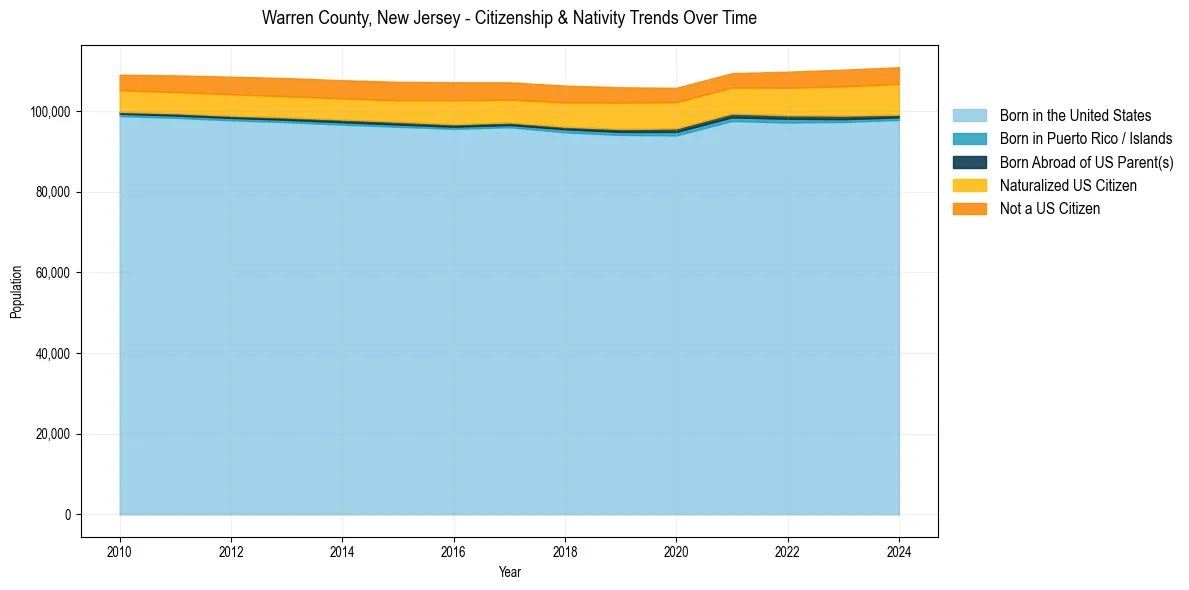
Warren County, New Jersey Population & Nativity History
| Year | Total Pop | Foreign Born | Native Born |
|---|---|---|---|
| 2024 | 110,849 | 10.6% | 89.4% |
| 2023 | 110,238 | 10.3% | 89.7% |
| 2022 | 109,739 | 9.9% | 90.1% |
| 2021 | 109,354 | 9.1% | 90.9% |
| 2020 | 105,730 | 9.5% | 90.5% |
| 2019 | 105,862 | 9.8% | 90.2% |
| 2018 | 106,293 | 9.6% | 90.4% |
| 2017 | 107,088 | 9.3% | 90.7% |
| 2016 | 107,095 | 9.7% | 90.3% |
| 2015 | 107,226 | 9.2% | 90.8% |
| 2014 | 107,624 | 9.1% | 90.9% |
| 2013 | 108,150 | 9.0% | 91.0% |
| 2012 | 108,488 | 8.9% | 91.1% |
| 2011 | 108,829 | 8.7% | 91.3% |
| 2010 | 108,982 | 8.4% | 91.6% |
Nativity & Citizenship FAQs for Warren County, New Jersey
Approximately 10.6% of residents in Warren County, New Jersey were born outside the United States.
The vast majority of residents, roughly 96.3%, are U.S. citizens (including both native-born and naturalized citizens).