Union County, New Jersey Nativity & Citizenship Status (2024)
Place of birth and citizenship status analysis for Union County, New Jersey
Union County, New Jersey Nativity & Citizenship Indicators (2024)
Native Born
66.4%
Foreign Born
33.6%
Naturalized
17.0%
US Citizens
83.4%
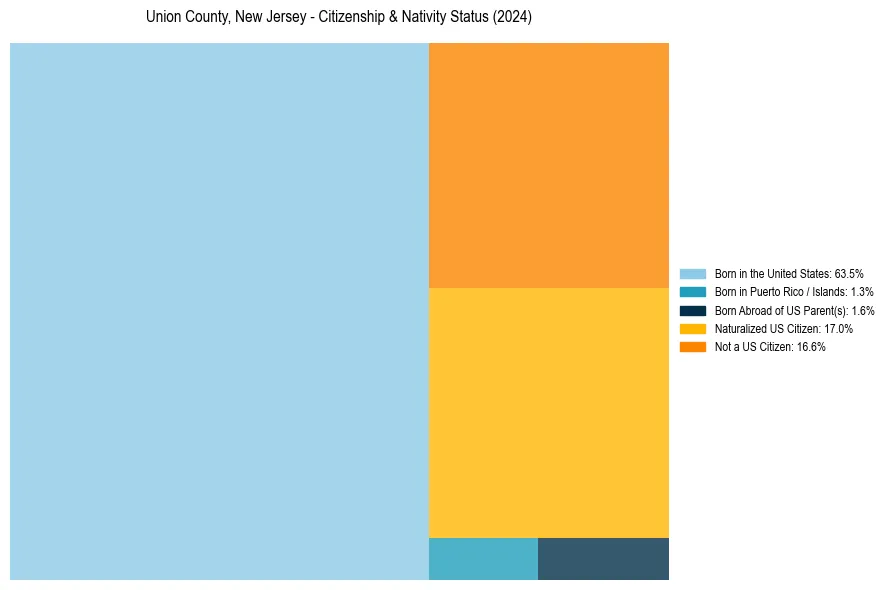
Union County, New Jersey Nativity & Citizenship Distribution
Union County, New Jersey Historical Nativity Trends (2010–2024)
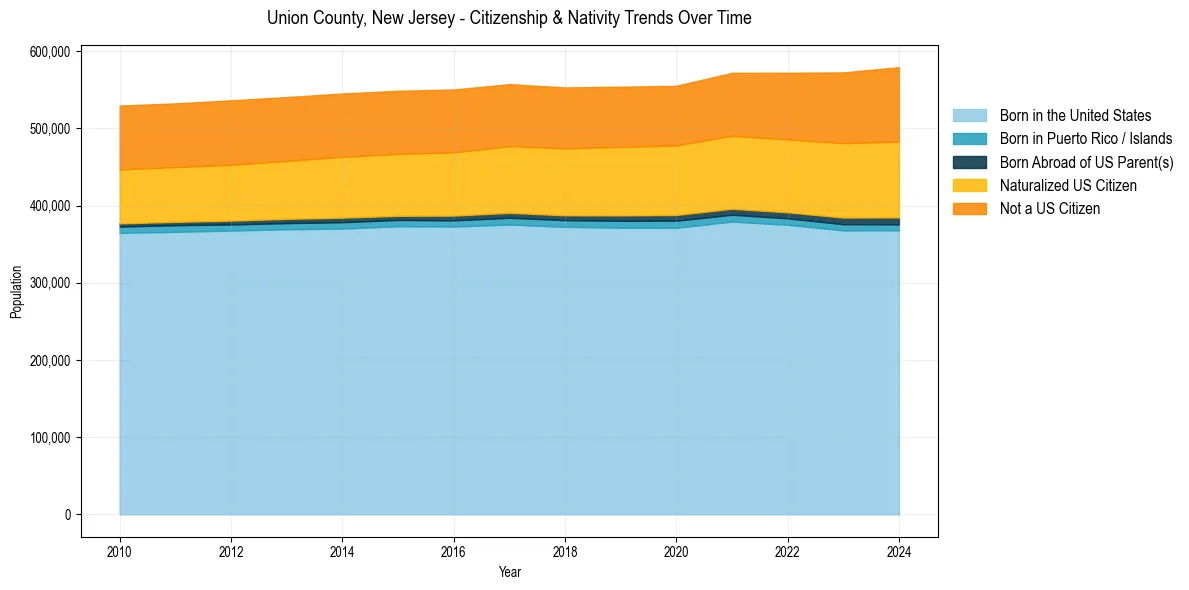
Union County, New Jersey Population & Nativity History
| Year | Total Pop | Foreign Born | Native Born |
|---|---|---|---|
| 2024 | 579,290 | 33.6% | 66.4% |
| 2023 | 572,549 | 32.8% | 67.2% |
| 2022 | 572,079 | 31.6% | 68.4% |
| 2021 | 571,963 | 30.8% | 69.2% |
| 2020 | 555,208 | 30.1% | 69.9% |
| 2019 | 554,033 | 30.1% | 69.9% |
| 2018 | 553,066 | 30.0% | 70.0% |
| 2017 | 557,320 | 29.9% | 70.1% |
| 2016 | 550,436 | 29.7% | 70.3% |
| 2015 | 548,744 | 29.5% | 70.5% |
| 2014 | 545,236 | 29.5% | 70.5% |
| 2013 | 540,568 | 29.2% | 70.8% |
| 2012 | 536,383 | 29.1% | 70.9% |
| 2011 | 532,378 | 28.8% | 71.2% |
| 2010 | 529,547 | 28.8% | 71.2% |
Nativity & Citizenship FAQs for Union County, New Jersey
Approximately 33.6% of residents in Union County, New Jersey were born outside the United States.
The vast majority of residents, roughly 83.4%, are U.S. citizens (including both native-born and naturalized citizens).