Sussex County, New Jersey Nativity & Citizenship Status (2024)
Place of birth and citizenship status analysis for Sussex County, New Jersey
Sussex County, New Jersey Nativity & Citizenship Indicators (2024)
Native Born
91.3%
Foreign Born
8.7%
Naturalized
6.0%
US Citizens
97.2%
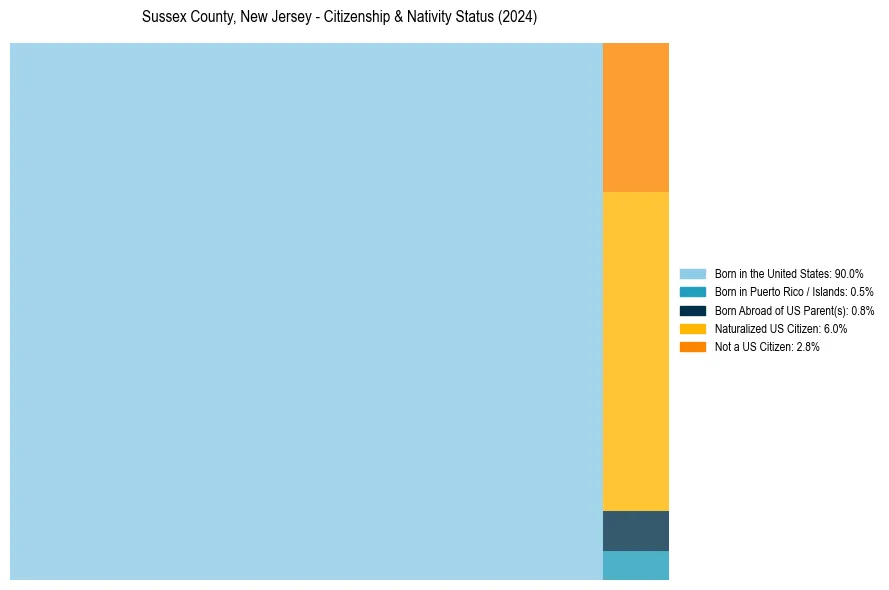
Sussex County, New Jersey Nativity & Citizenship Distribution
Sussex County, New Jersey Historical Nativity Trends (2010–2024)
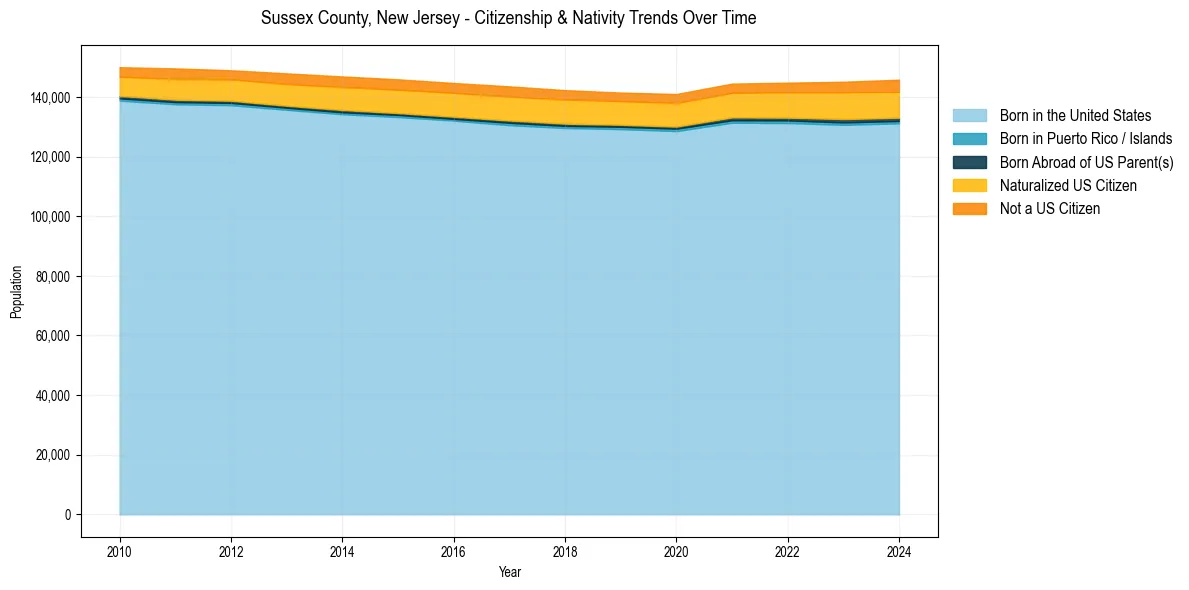
Sussex County, New Jersey Population & Nativity History
| Year | Total Pop | Foreign Born | Native Born |
|---|---|---|---|
| 2024 | 145,807 | 8.7% | 91.3% |
| 2023 | 145,117 | 8.6% | 91.4% |
| 2022 | 144,808 | 8.1% | 91.9% |
| 2021 | 144,492 | 7.9% | 92.1% |
| 2020 | 140,996 | 7.8% | 92.2% |
| 2019 | 141,483 | 7.6% | 92.4% |
| 2018 | 142,298 | 7.9% | 92.1% |
| 2017 | 143,570 | 8.0% | 92.0% |
| 2016 | 144,694 | 7.8% | 92.2% |
| 2015 | 145,930 | 7.8% | 92.2% |
| 2014 | 146,888 | 7.7% | 92.3% |
| 2013 | 147,924 | 7.3% | 92.7% |
| 2012 | 148,962 | 6.9% | 93.1% |
| 2011 | 149,589 | 7.0% | 93.0% |
| 2010 | 149,996 | 6.4% | 93.6% |
Nativity & Citizenship FAQs for Sussex County, New Jersey
Approximately 8.7% of residents in Sussex County, New Jersey were born outside the United States.
The vast majority of residents, roughly 97.2%, are U.S. citizens (including both native-born and naturalized citizens).