Passaic County, New Jersey Nativity & Citizenship Status (2024)
Place of birth and citizenship status analysis for Passaic County, New Jersey
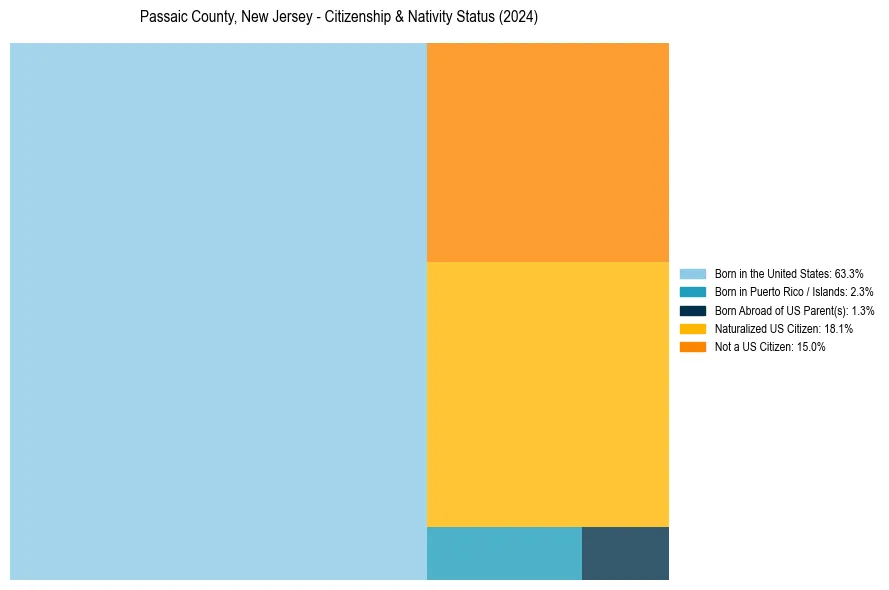
Passaic County, New Jersey Nativity & Citizenship Indicators (2024)
Native Born
66.9%
Foreign Born
33.1%
Naturalized
18.1%
US Citizens
85.0%
Passaic County, New Jersey Nativity & Citizenship Distribution
Passaic County, New Jersey Historical Nativity Trends (2010–2024)
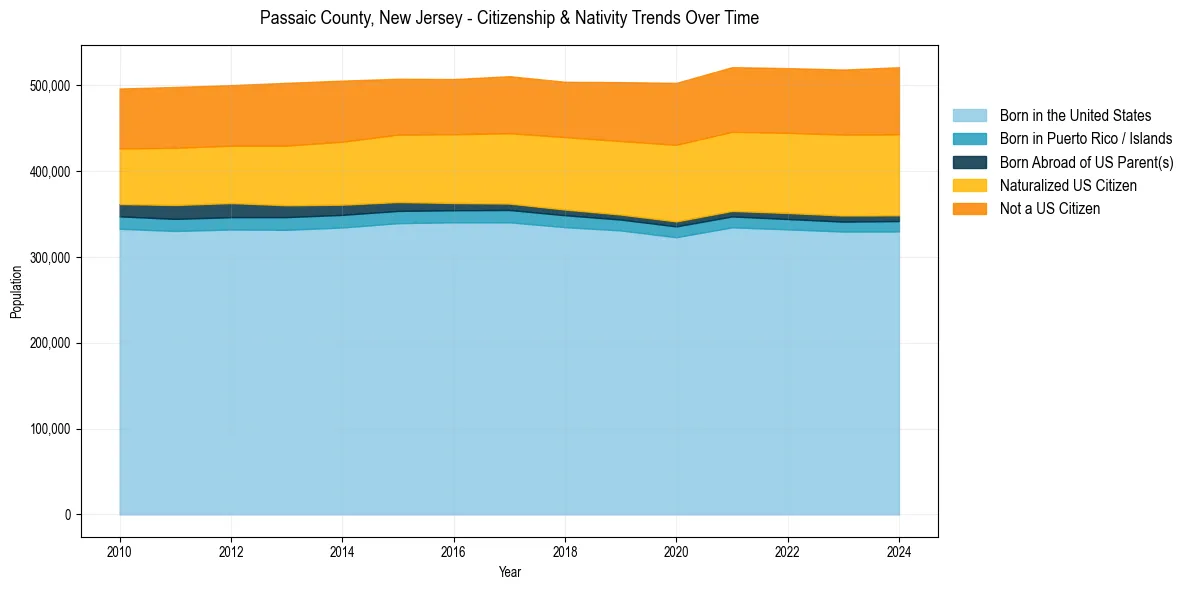
Passaic County, New Jersey Population & Nativity History
| Year | Total Pop | Foreign Born | Native Born |
|---|---|---|---|
| 2024 | 521,012 | 33.1% | 66.9% |
| 2023 | 518,289 | 32.8% | 67.2% |
| 2022 | 519,986 | 32.5% | 67.5% |
| 2021 | 521,067 | 32.1% | 67.9% |
| 2020 | 502,763 | 32.1% | 67.9% |
| 2019 | 503,637 | 30.6% | 69.4% |
| 2018 | 504,041 | 29.5% | 70.5% |
| 2017 | 510,563 | 29.1% | 70.9% |
| 2016 | 507,204 | 28.5% | 71.5% |
| 2015 | 507,574 | 28.3% | 71.7% |
| 2014 | 505,403 | 28.6% | 71.4% |
| 2013 | 502,854 | 28.4% | 71.6% |
| 2012 | 500,168 | 27.5% | 72.5% |
| 2011 | 498,009 | 27.6% | 72.4% |
| 2010 | 496,204 | 27.1% | 72.9% |
Nativity & Citizenship FAQs for Passaic County, New Jersey
Approximately 33.1% of residents in Passaic County, New Jersey were born outside the United States.
The vast majority of residents, roughly 85.0%, are U.S. citizens (including both native-born and naturalized citizens).