Ocean County, New Jersey Nativity & Citizenship Status (2024)
Place of birth and citizenship status analysis for Ocean County, New Jersey
Ocean County, New Jersey Nativity & Citizenship Indicators (2024)
Native Born
92.0%
Foreign Born
8.0%
Naturalized
5.1%
US Citizens
97.0%
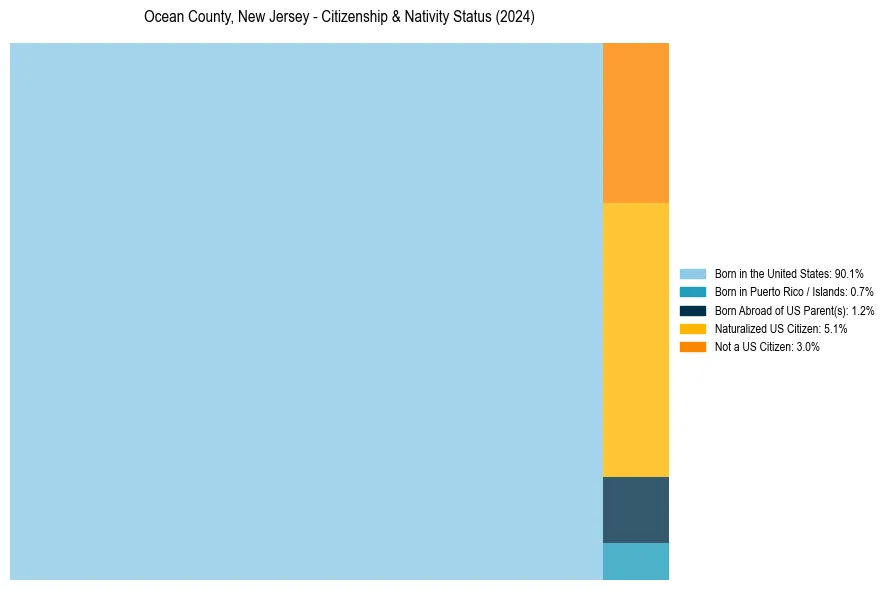
Ocean County, New Jersey Nativity & Citizenship Distribution
Ocean County, New Jersey Historical Nativity Trends (2010–2024)
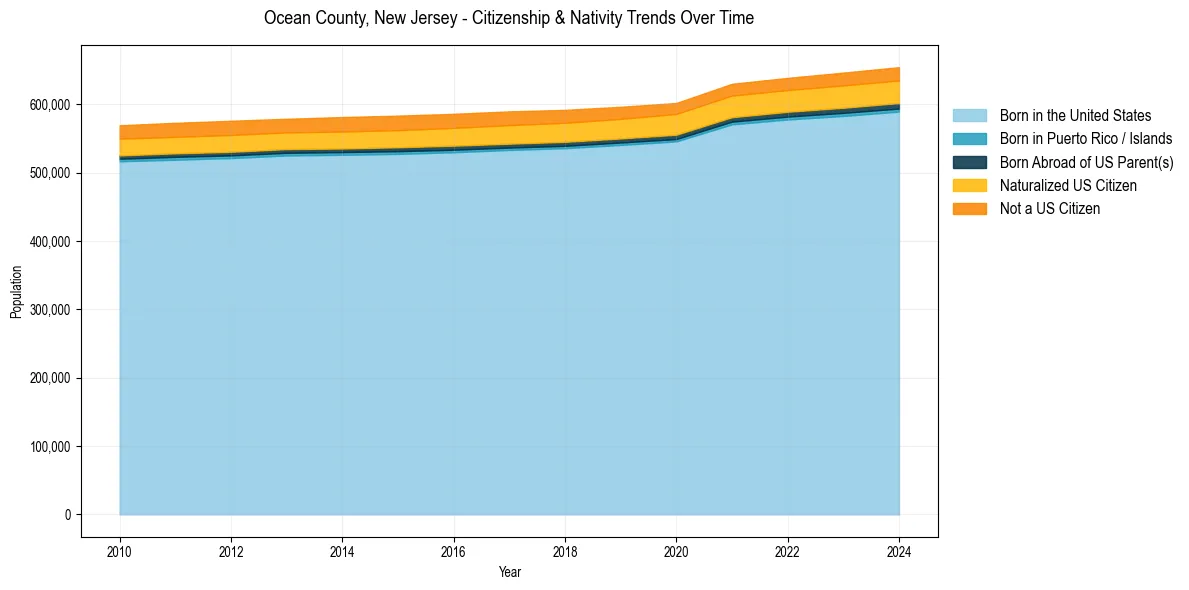
Ocean County, New Jersey Population & Nativity History
| Year | Total Pop | Foreign Born | Native Born |
|---|---|---|---|
| 2024 | 654,362 | 8.0% | 92.0% |
| 2023 | 646,434 | 8.0% | 92.0% |
| 2022 | 638,691 | 7.8% | 92.2% |
| 2021 | 630,057 | 7.8% | 92.2% |
| 2020 | 602,018 | 7.7% | 92.3% |
| 2019 | 596,415 | 7.8% | 92.2% |
| 2018 | 591,939 | 7.9% | 92.1% |
| 2017 | 589,699 | 8.0% | 92.0% |
| 2016 | 586,166 | 8.0% | 92.0% |
| 2015 | 583,450 | 7.9% | 92.1% |
| 2014 | 581,413 | 7.9% | 92.1% |
| 2013 | 578,902 | 7.7% | 92.3% |
| 2012 | 575,961 | 7.9% | 92.1% |
| 2011 | 572,991 | 7.8% | 92.2% |
| 2010 | 569,374 | 7.8% | 92.2% |
Nativity & Citizenship FAQs for Ocean County, New Jersey
Approximately 8.0% of residents in Ocean County, New Jersey were born outside the United States.
The vast majority of residents, roughly 97.0%, are U.S. citizens (including both native-born and naturalized citizens).