New Jersey Nativity & Citizenship Status (2024)
Place of birth and citizenship status analysis for New Jersey
New Jersey Nativity & Citizenship Indicators (2024)
Native Born
76.1%
Foreign Born
23.9%
Naturalized
13.5%
US Citizens
89.5%
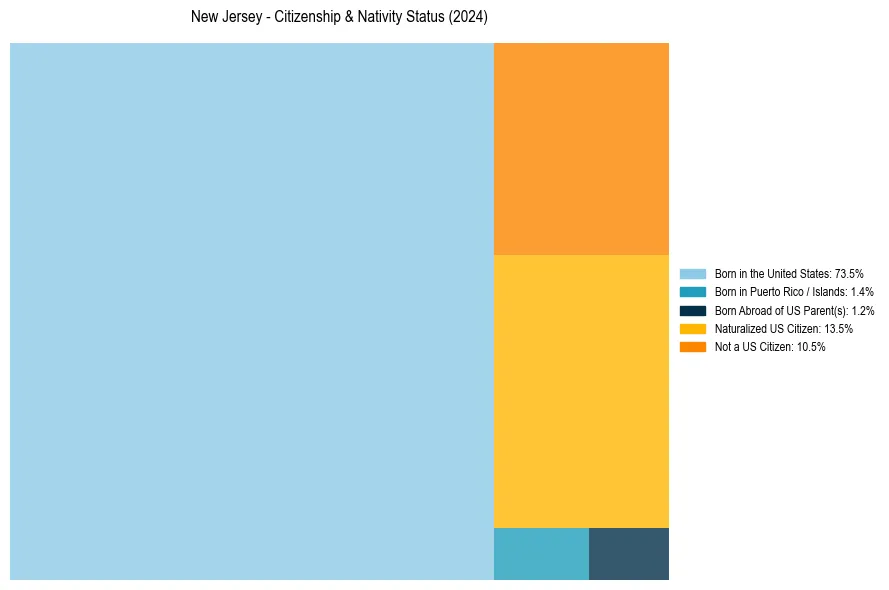
New Jersey Nativity & Citizenship Distribution
New Jersey Historical Nativity Trends (2010–2024)
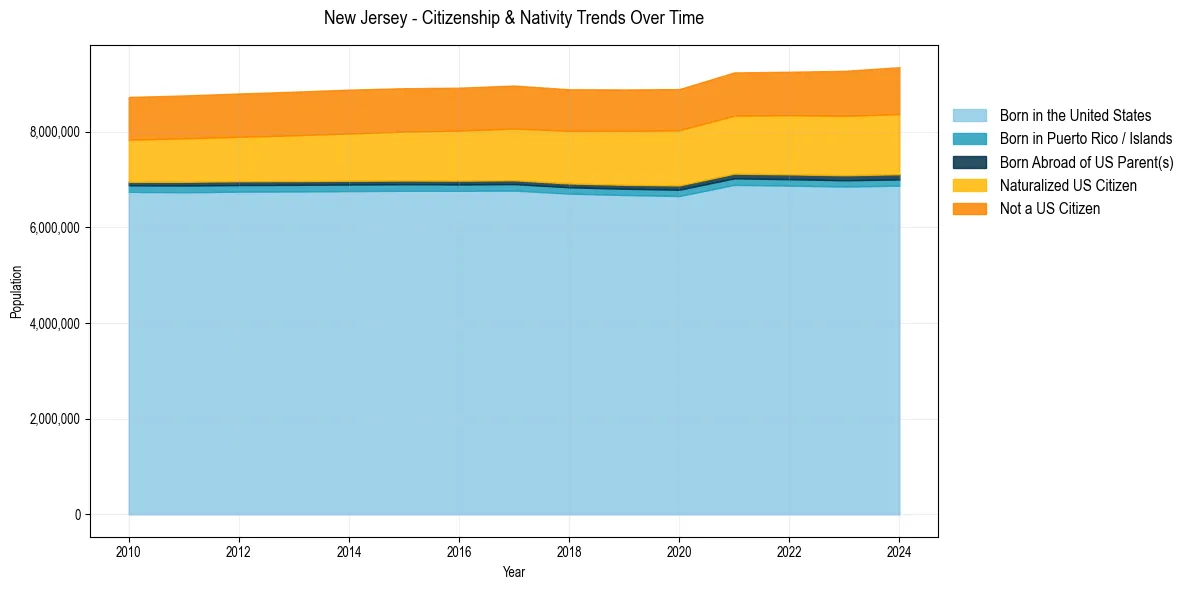
New Jersey Population & Nativity History
| Year | Total Pop | Foreign Born | Native Born |
|---|---|---|---|
| 2024 | 9,343,809 | 23.9% | 76.1% |
| 2023 | 9,267,014 | 23.5% | 76.5% |
| 2022 | 9,249,063 | 23.2% | 76.8% |
| 2021 | 9,234,024 | 22.9% | 77.1% |
| 2020 | 8,885,418 | 22.7% | 77.3% |
| 2019 | 8,878,503 | 22.4% | 77.6% |
| 2018 | 8,881,845 | 22.2% | 77.8% |
| 2017 | 8,960,161 | 22.1% | 77.9% |
| 2016 | 8,915,456 | 21.8% | 78.2% |
| 2015 | 8,904,413 | 21.7% | 78.3% |
| 2014 | 8,874,374 | 21.5% | 78.5% |
| 2013 | 8,832,406 | 21.2% | 78.8% |
| 2012 | 8,793,888 | 20.8% | 79.2% |
| 2011 | 8,753,064 | 20.6% | 79.4% |
| 2010 | 8,721,577 | 20.3% | 79.7% |
Nativity & Citizenship FAQs for New Jersey
Approximately 23.9% of residents in New Jersey were born outside the United States.
The vast majority of residents, roughly 89.5%, are U.S. citizens (including both native-born and naturalized citizens).