Monmouth County, New Jersey Nativity & Citizenship Status (2024)
Place of birth and citizenship status analysis for Monmouth County, New Jersey
Monmouth County, New Jersey Nativity & Citizenship Indicators (2024)
Native Born
86.4%
Foreign Born
13.6%
Naturalized
8.7%
US Citizens
95.1%
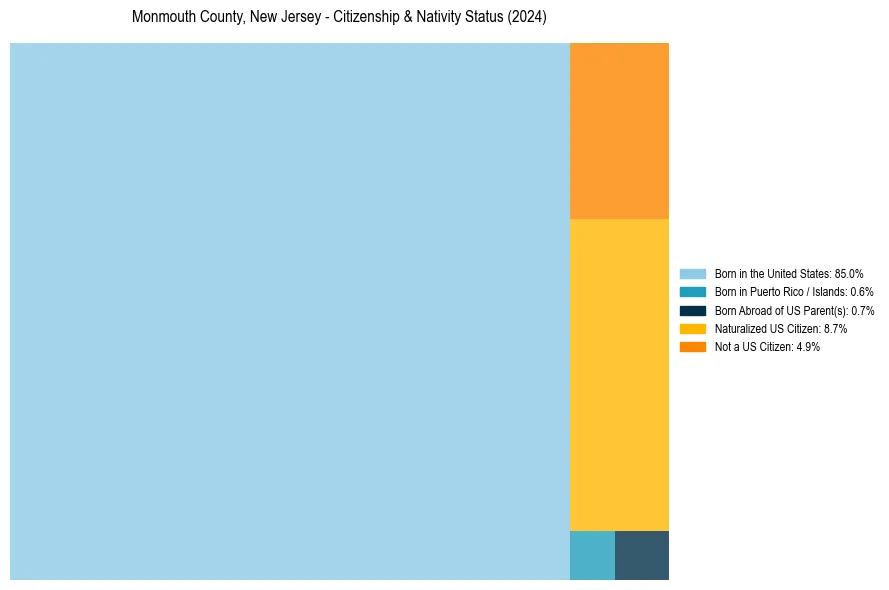
Monmouth County, New Jersey Nativity & Citizenship Distribution
Monmouth County, New Jersey Historical Nativity Trends (2010–2024)
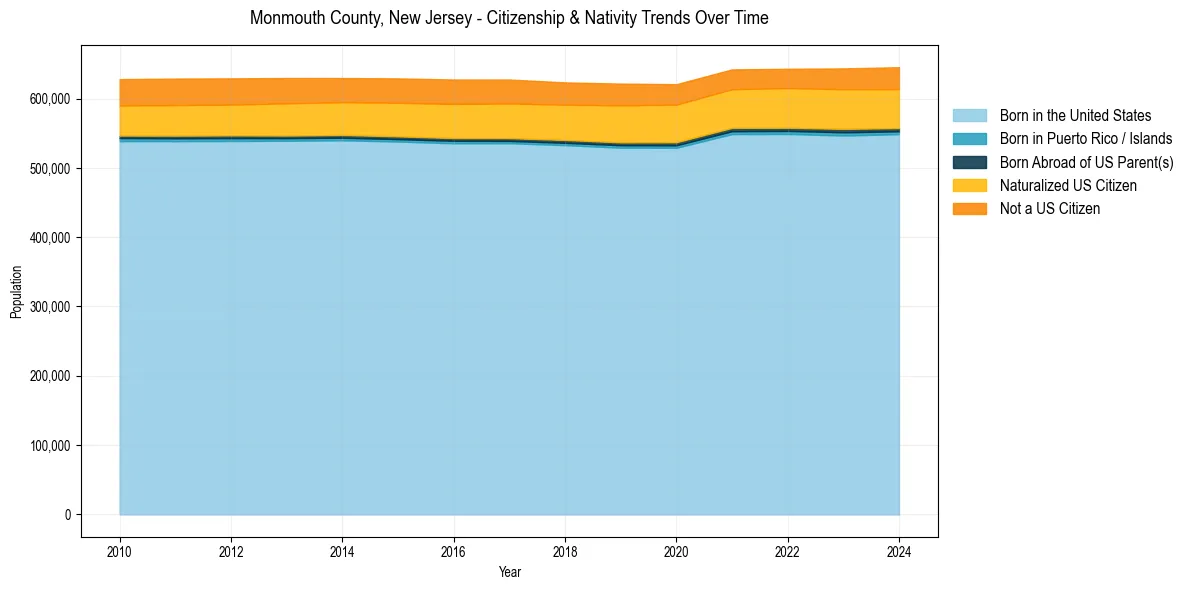
Monmouth County, New Jersey Population & Nativity History
| Year | Total Pop | Foreign Born | Native Born |
|---|---|---|---|
| 2024 | 645,353 | 13.6% | 86.4% |
| 2023 | 643,615 | 13.6% | 86.4% |
| 2022 | 643,064 | 13.2% | 86.8% |
| 2021 | 642,160 | 13.1% | 86.9% |
| 2020 | 620,821 | 13.5% | 86.5% |
| 2019 | 621,659 | 13.6% | 86.4% |
| 2018 | 623,387 | 13.3% | 86.7% |
| 2017 | 627,551 | 13.5% | 86.5% |
| 2016 | 627,532 | 13.5% | 86.5% |
| 2015 | 629,185 | 13.3% | 86.7% |
| 2014 | 629,702 | 13.0% | 87.0% |
| 2013 | 629,735 | 13.2% | 86.8% |
| 2012 | 629,263 | 13.1% | 86.9% |
| 2011 | 628,920 | 13.1% | 86.9% |
| 2010 | 628,112 | 13.0% | 87.0% |
Nativity & Citizenship FAQs for Monmouth County, New Jersey
Approximately 13.6% of residents in Monmouth County, New Jersey were born outside the United States.
The vast majority of residents, roughly 95.1%, are U.S. citizens (including both native-born and naturalized citizens).