Middlesex County, New Jersey Nativity & Citizenship Status (2024)
Place of birth and citizenship status analysis for Middlesex County, New Jersey
Middlesex County, New Jersey Nativity & Citizenship Indicators (2024)
Native Born
64.6%
Foreign Born
35.4%
Naturalized
20.1%
US Citizens
84.8%
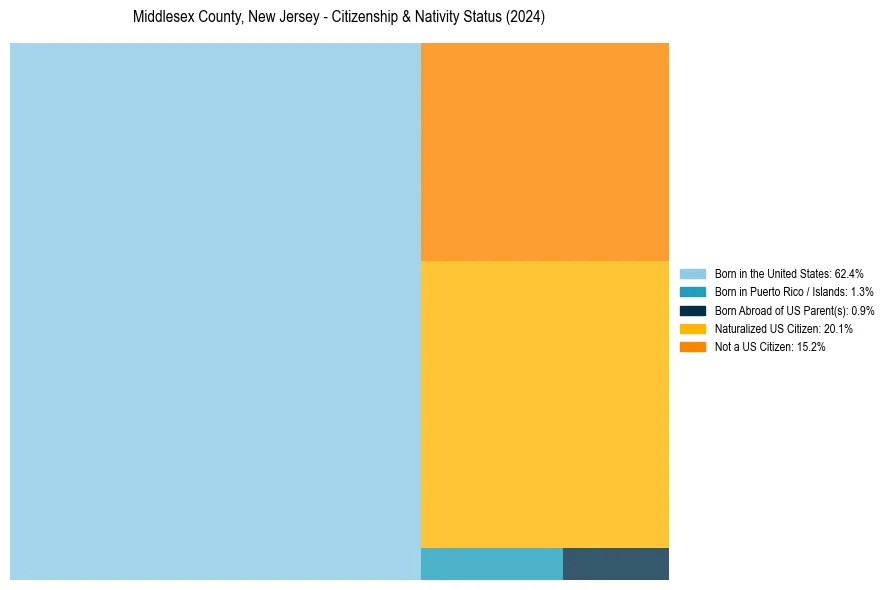
Middlesex County, New Jersey Nativity & Citizenship Distribution
Middlesex County, New Jersey Historical Nativity Trends (2010–2024)
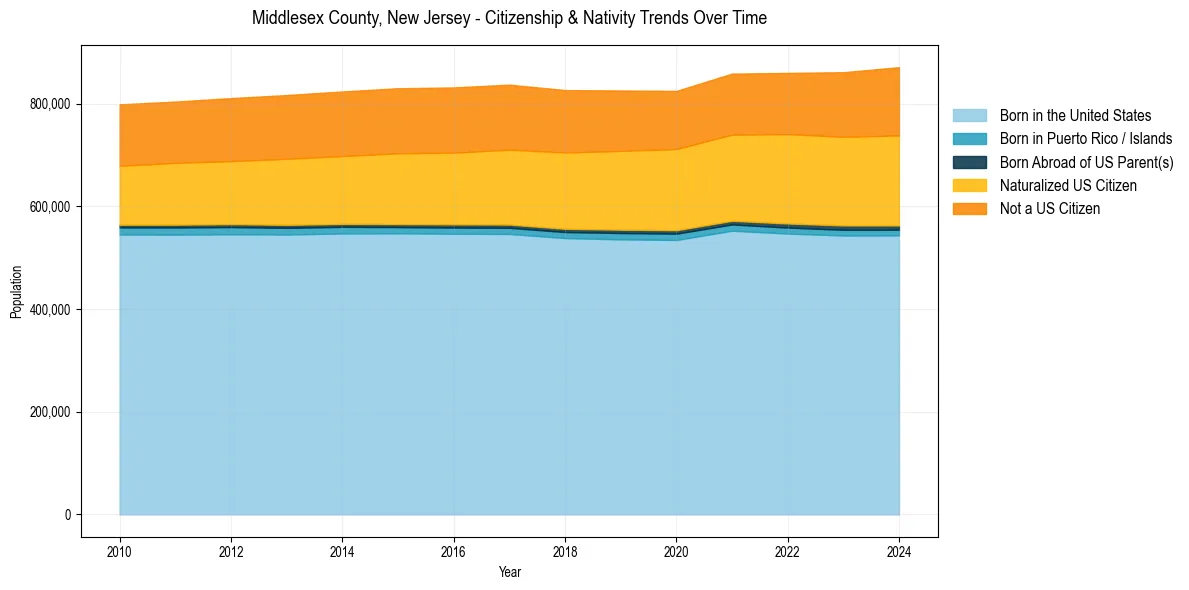
Middlesex County, New Jersey Population & Nativity History
| Year | Total Pop | Foreign Born | Native Born |
|---|---|---|---|
| 2024 | 871,290 | 35.4% | 64.6% |
| 2023 | 861,535 | 34.7% | 65.3% |
| 2022 | 860,147 | 34.1% | 65.9% |
| 2021 | 858,770 | 33.4% | 66.6% |
| 2020 | 825,015 | 32.9% | 67.1% |
| 2019 | 825,920 | 32.8% | 67.2% |
| 2018 | 826,698 | 32.7% | 67.3% |
| 2017 | 837,288 | 32.6% | 67.4% |
| 2016 | 831,852 | 32.1% | 67.9% |
| 2015 | 830,300 | 31.9% | 68.1% |
| 2014 | 824,046 | 31.3% | 68.7% |
| 2013 | 817,026 | 31.0% | 69.0% |
| 2012 | 811,064 | 30.3% | 69.7% |
| 2011 | 804,299 | 29.8% | 70.2% |
| 2010 | 798,882 | 29.4% | 70.6% |
Nativity & Citizenship FAQs for Middlesex County, New Jersey
Approximately 35.4% of residents in Middlesex County, New Jersey were born outside the United States.
The vast majority of residents, roughly 84.8%, are U.S. citizens (including both native-born and naturalized citizens).