Hunterdon County, New Jersey Nativity & Citizenship Status (2024)
Place of birth and citizenship status analysis for Hunterdon County, New Jersey
Hunterdon County, New Jersey Nativity & Citizenship Indicators (2024)
Native Born
89.4%
Foreign Born
10.6%
Naturalized
7.0%
US Citizens
96.4%
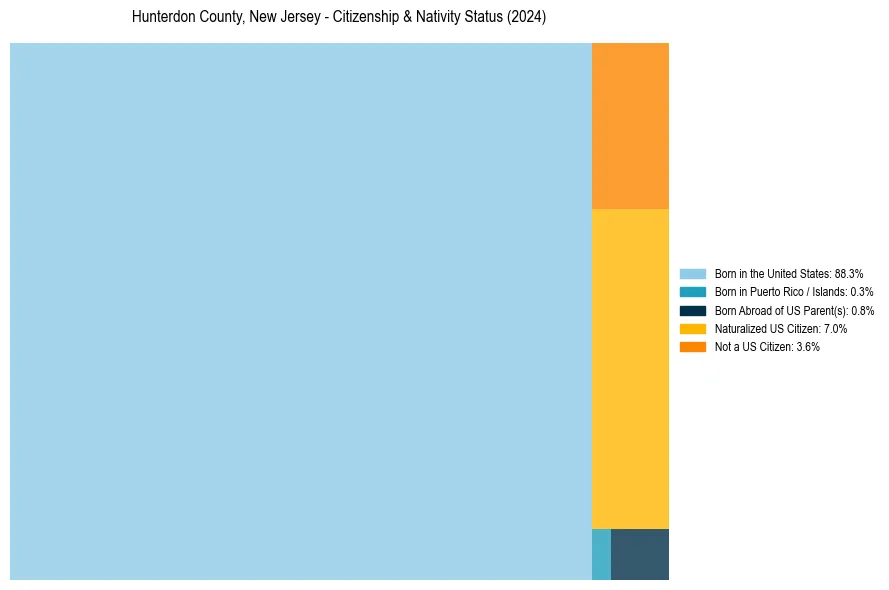
Hunterdon County, New Jersey Nativity & Citizenship Distribution
Hunterdon County, New Jersey Historical Nativity Trends (2010–2024)
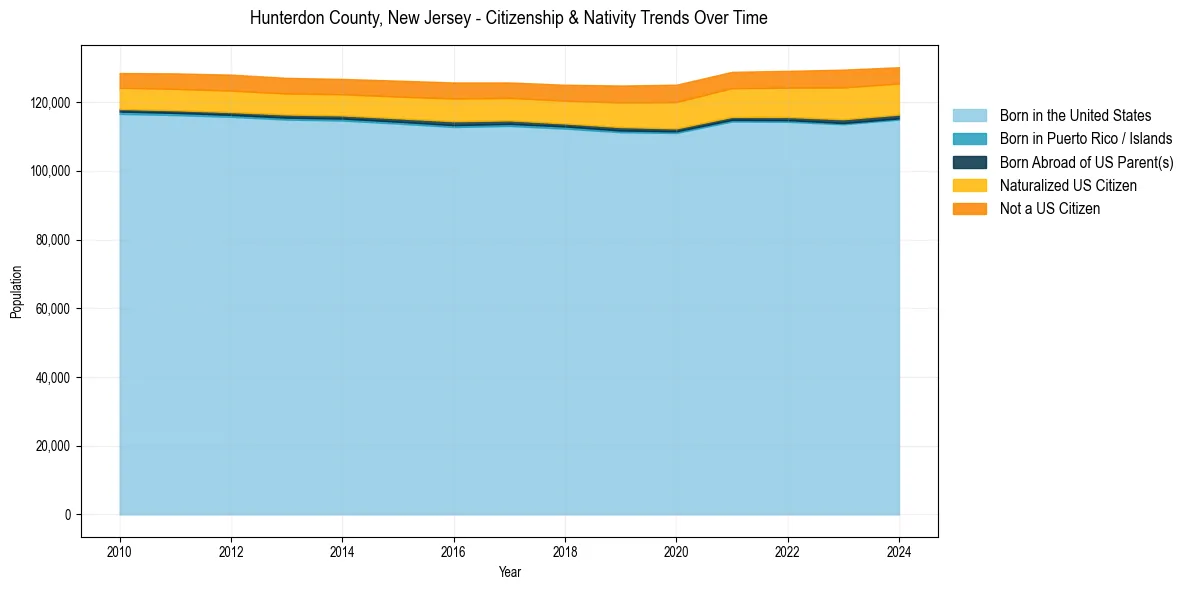
Hunterdon County, New Jersey Population & Nativity History
| Year | Total Pop | Foreign Born | Native Born |
|---|---|---|---|
| 2024 | 130,160 | 10.6% | 89.4% |
| 2023 | 129,448 | 11.2% | 88.8% |
| 2022 | 129,099 | 10.4% | 89.6% |
| 2021 | 128,807 | 10.2% | 89.8% |
| 2020 | 125,063 | 10.2% | 89.8% |
| 2019 | 124,823 | 9.7% | 90.3% |
| 2018 | 125,051 | 9.0% | 91.0% |
| 2017 | 125,717 | 8.8% | 91.2% |
| 2016 | 125,708 | 9.0% | 91.0% |
| 2015 | 126,250 | 8.7% | 91.3% |
| 2014 | 126,746 | 8.4% | 91.6% |
| 2013 | 127,047 | 8.4% | 91.6% |
| 2012 | 127,996 | 8.5% | 91.5% |
| 2011 | 128,355 | 8.4% | 91.6% |
| 2010 | 128,458 | 8.2% | 91.8% |
Nativity & Citizenship FAQs for Hunterdon County, New Jersey
Approximately 10.6% of residents in Hunterdon County, New Jersey were born outside the United States.
The vast majority of residents, roughly 96.4%, are U.S. citizens (including both native-born and naturalized citizens).