Hudson County, New Jersey Nativity & Citizenship Status (2024)
Place of birth and citizenship status analysis for Hudson County, New Jersey
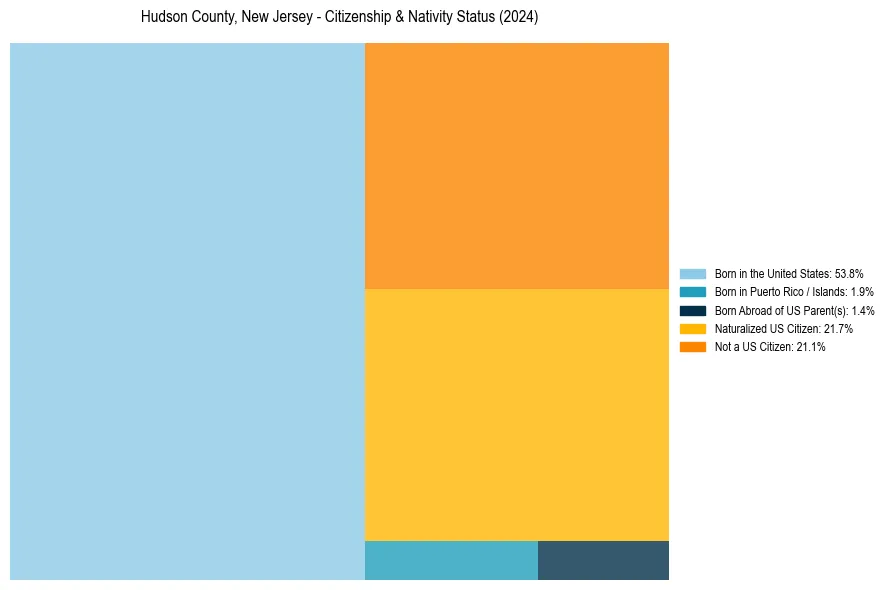
Hudson County, New Jersey Nativity & Citizenship Indicators (2024)
Native Born
57.2%
Foreign Born
42.8%
Naturalized
21.7%
US Citizens
78.9%
Hudson County, New Jersey Nativity & Citizenship Distribution
Hudson County, New Jersey Historical Nativity Trends (2010–2024)
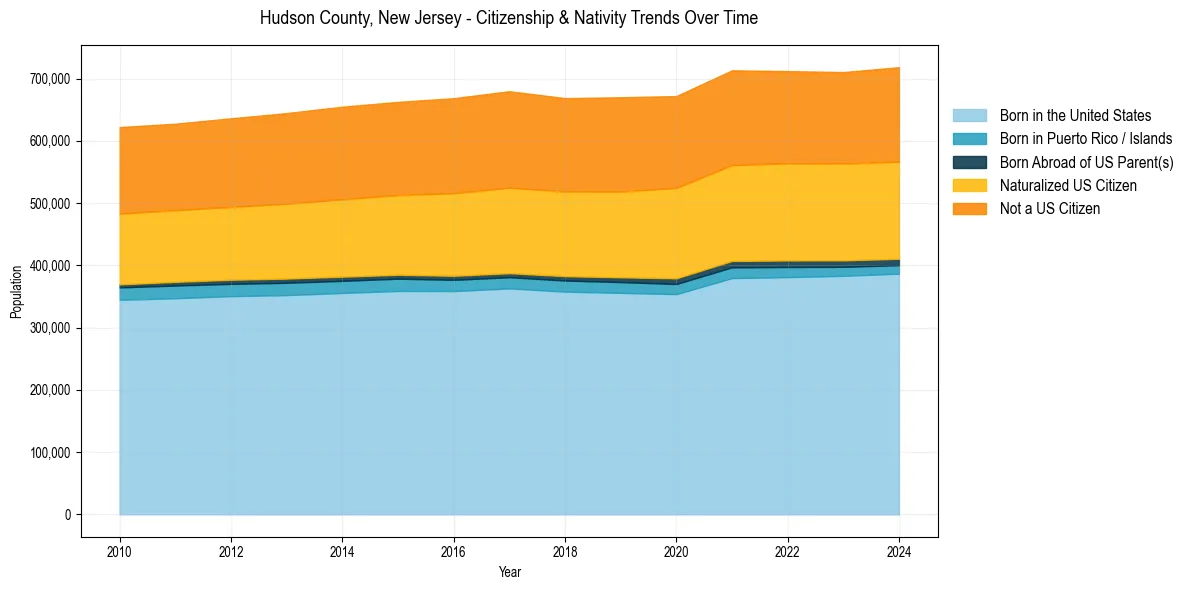
Hudson County, New Jersey Population & Nativity History
| Year | Total Pop | Foreign Born | Native Born |
|---|---|---|---|
| 2024 | 718,323 | 42.8% | 57.2% |
| 2023 | 710,478 | 42.6% | 57.4% |
| 2022 | 712,029 | 42.7% | 57.3% |
| 2021 | 713,264 | 42.9% | 57.1% |
| 2020 | 671,923 | 43.6% | 56.4% |
| 2019 | 670,046 | 43.2% | 56.8% |
| 2018 | 668,631 | 42.8% | 57.2% |
| 2017 | 679,756 | 43.0% | 57.0% |
| 2016 | 668,526 | 42.7% | 57.3% |
| 2015 | 662,619 | 41.9% | 58.1% |
| 2014 | 654,878 | 41.7% | 58.3% |
| 2013 | 644,605 | 41.2% | 58.8% |
| 2012 | 636,194 | 40.8% | 59.2% |
| 2011 | 627,589 | 40.5% | 59.5% |
| 2010 | 622,123 | 40.6% | 59.4% |
Nativity & Citizenship FAQs for Hudson County, New Jersey
Approximately 42.8% of residents in Hudson County, New Jersey were born outside the United States.
The vast majority of residents, roughly 78.9%, are U.S. citizens (including both native-born and naturalized citizens).