Gloucester County, New Jersey Nativity & Citizenship Status (2024)
Place of birth and citizenship status analysis for Gloucester County, New Jersey
Gloucester County, New Jersey Nativity & Citizenship Indicators (2024)
Native Born
93.9%
Foreign Born
6.1%
Naturalized
3.7%
US Citizens
97.6%
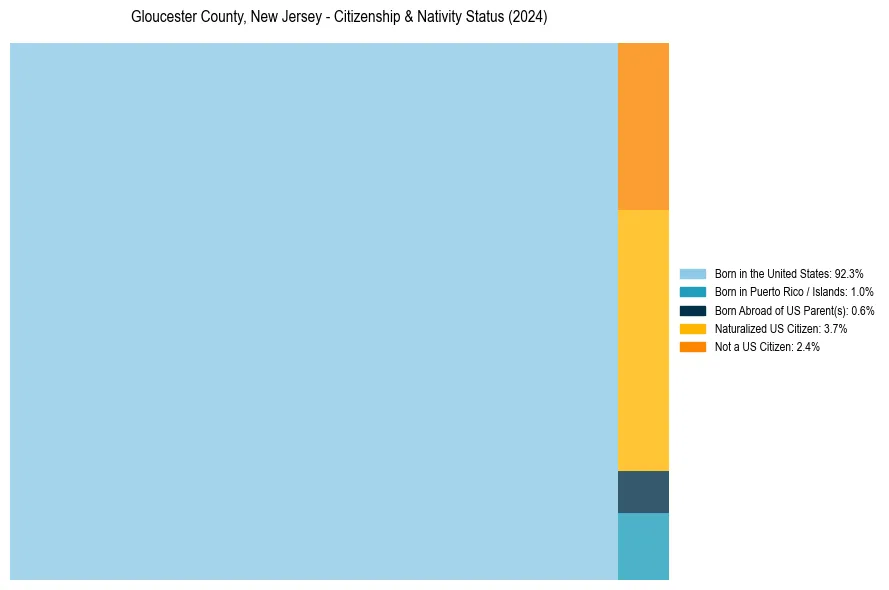
Gloucester County, New Jersey Nativity & Citizenship Distribution
Gloucester County, New Jersey Historical Nativity Trends (2010–2024)
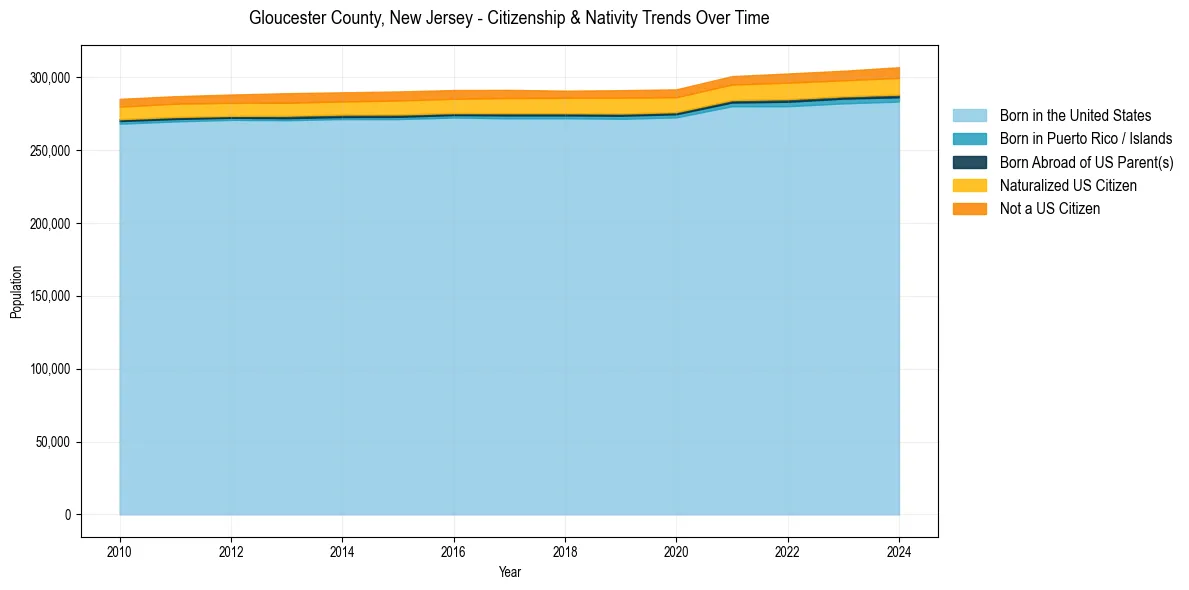
Gloucester County, New Jersey Population & Nativity History
| Year | Total Pop | Foreign Born | Native Born |
|---|---|---|---|
| 2024 | 306,954 | 6.1% | 93.9% |
| 2023 | 304,504 | 5.8% | 94.2% |
| 2022 | 302,621 | 5.8% | 94.2% |
| 2021 | 300,821 | 5.5% | 94.5% |
| 2020 | 291,745 | 5.4% | 94.6% |
| 2019 | 291,165 | 5.5% | 94.5% |
| 2018 | 290,852 | 5.3% | 94.7% |
| 2017 | 291,372 | 5.5% | 94.5% |
| 2016 | 291,286 | 5.4% | 94.6% |
| 2015 | 290,298 | 5.4% | 94.6% |
| 2014 | 289,705 | 5.3% | 94.7% |
| 2013 | 289,098 | 5.3% | 94.7% |
| 2012 | 288,187 | 5.1% | 94.9% |
| 2011 | 287,036 | 5.0% | 95.0% |
| 2010 | 285,223 | 4.9% | 95.1% |
Nativity & Citizenship FAQs for Gloucester County, New Jersey
Approximately 6.1% of residents in Gloucester County, New Jersey were born outside the United States.
The vast majority of residents, roughly 97.6%, are U.S. citizens (including both native-born and naturalized citizens).