Essex County, New Jersey Nativity & Citizenship Status (2024)
Place of birth and citizenship status analysis for Essex County, New Jersey
Essex County, New Jersey Nativity & Citizenship Indicators (2024)
Native Born
69.9%
Foreign Born
30.1%
Naturalized
15.1%
US Citizens
84.9%
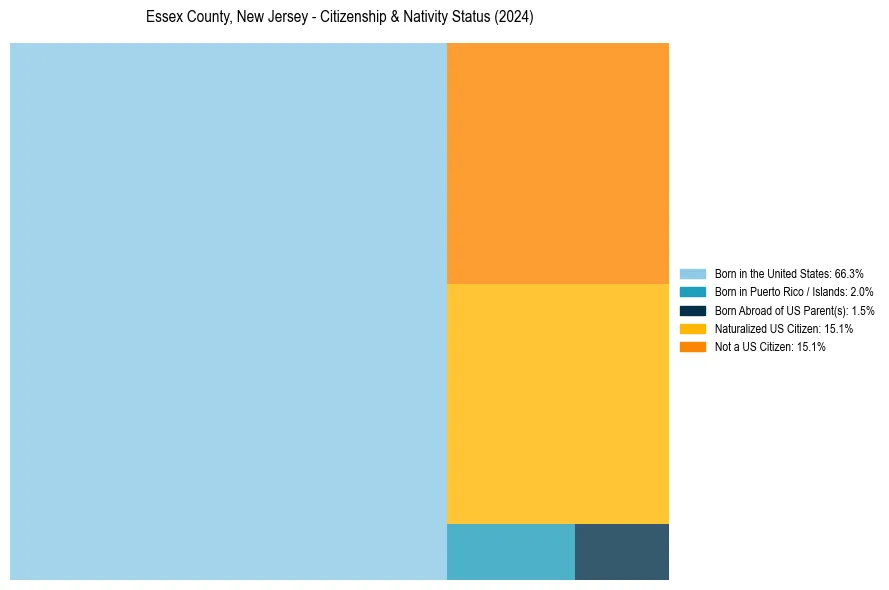
Essex County, New Jersey Nativity & Citizenship Distribution
Essex County, New Jersey Historical Nativity Trends (2010–2024)
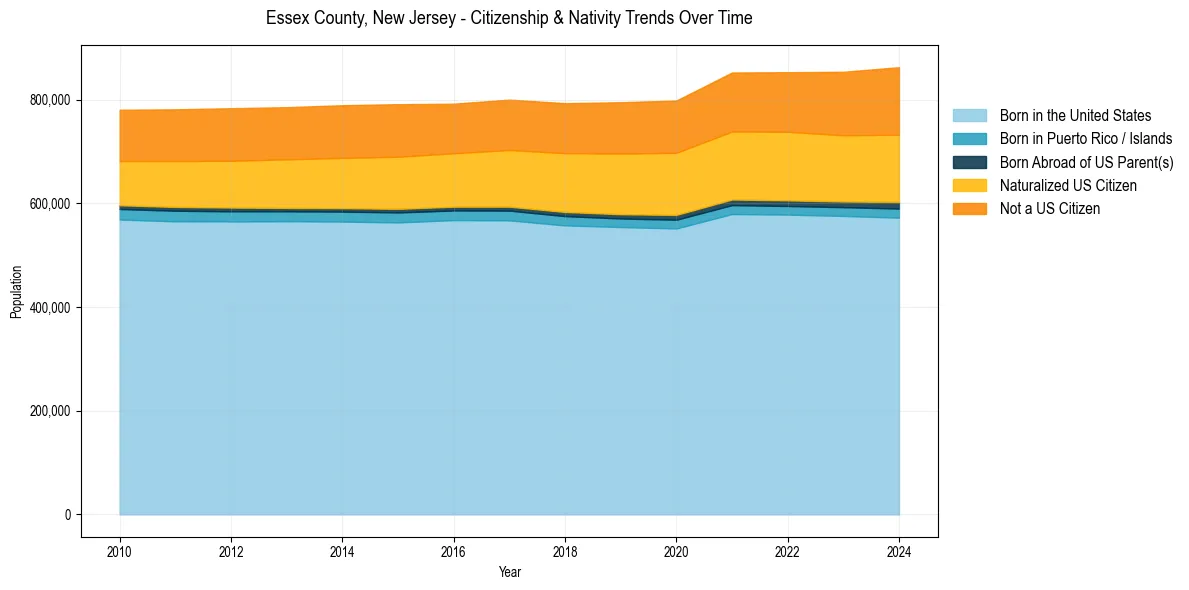
Essex County, New Jersey Population & Nativity History
| Year | Total Pop | Foreign Born | Native Born |
|---|---|---|---|
| 2024 | 863,002 | 30.1% | 69.9% |
| 2023 | 854,130 | 29.3% | 70.7% |
| 2022 | 853,374 | 29.0% | 71.0% |
| 2021 | 852,720 | 28.7% | 71.3% |
| 2020 | 798,698 | 27.7% | 72.3% |
| 2019 | 795,404 | 27.2% | 72.8% |
| 2018 | 793,555 | 26.5% | 73.5% |
| 2017 | 800,401 | 25.8% | 74.2% |
| 2016 | 792,586 | 25.1% | 74.9% |
| 2015 | 791,609 | 25.5% | 74.5% |
| 2014 | 789,616 | 25.2% | 74.8% |
| 2013 | 785,853 | 24.8% | 75.2% |
| 2012 | 783,840 | 24.5% | 75.5% |
| 2011 | 781,668 | 24.1% | 75.9% |
| 2010 | 780,872 | 23.6% | 76.4% |
Nativity & Citizenship FAQs for Essex County, New Jersey
Approximately 30.1% of residents in Essex County, New Jersey were born outside the United States.
The vast majority of residents, roughly 84.9%, are U.S. citizens (including both native-born and naturalized citizens).