Cumberland County, New Jersey Nativity & Citizenship Status (2024)
Place of birth and citizenship status analysis for Cumberland County, New Jersey
Cumberland County, New Jersey Nativity & Citizenship Indicators (2024)
Native Born
87.3%
Foreign Born
12.7%
Naturalized
4.7%
US Citizens
91.9%
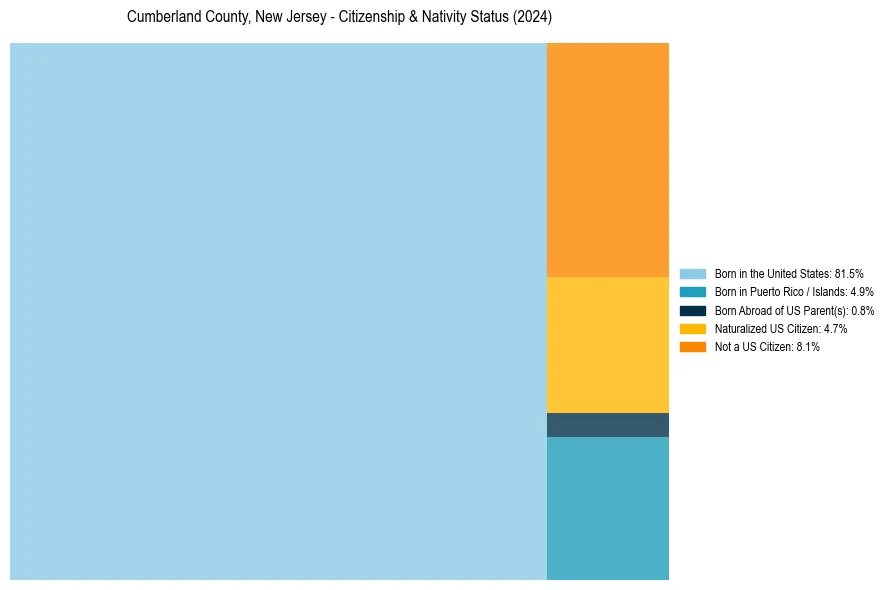
Cumberland County, New Jersey Nativity & Citizenship Distribution
Cumberland County, New Jersey Historical Nativity Trends (2010–2024)
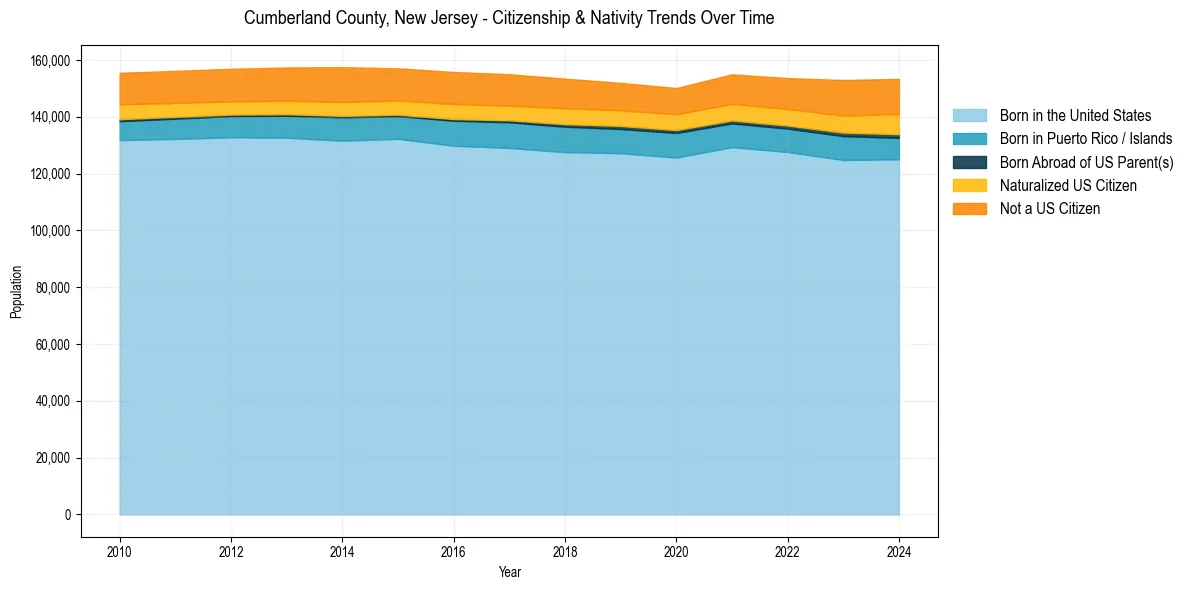
Cumberland County, New Jersey Population & Nativity History
| Year | Total Pop | Foreign Born | Native Born |
|---|---|---|---|
| 2024 | 153,305 | 12.7% | 87.3% |
| 2023 | 152,915 | 12.1% | 87.9% |
| 2022 | 153,588 | 10.9% | 89.1% |
| 2021 | 154,921 | 10.5% | 89.5% |
| 2020 | 150,085 | 9.9% | 90.1% |
| 2019 | 151,906 | 10.0% | 90.0% |
| 2018 | 153,400 | 10.4% | 89.6% |
| 2017 | 154,952 | 10.5% | 89.5% |
| 2016 | 155,744 | 10.6% | 89.4% |
| 2015 | 157,035 | 10.4% | 89.6% |
| 2014 | 157,429 | 10.9% | 89.1% |
| 2013 | 157,342 | 10.5% | 89.5% |
| 2012 | 156,864 | 10.3% | 89.7% |
| 2011 | 156,142 | 10.4% | 89.6% |
| 2010 | 155,456 | 10.5% | 89.5% |
Nativity & Citizenship FAQs for Cumberland County, New Jersey
Approximately 12.7% of residents in Cumberland County, New Jersey were born outside the United States.
The vast majority of residents, roughly 91.9%, are U.S. citizens (including both native-born and naturalized citizens).