Camden County, New Jersey Nativity & Citizenship Status (2024)
Place of birth and citizenship status analysis for Camden County, New Jersey
Camden County, New Jersey Nativity & Citizenship Indicators (2024)
Native Born
87.7%
Foreign Born
12.3%
Naturalized
6.8%
US Citizens
94.5%
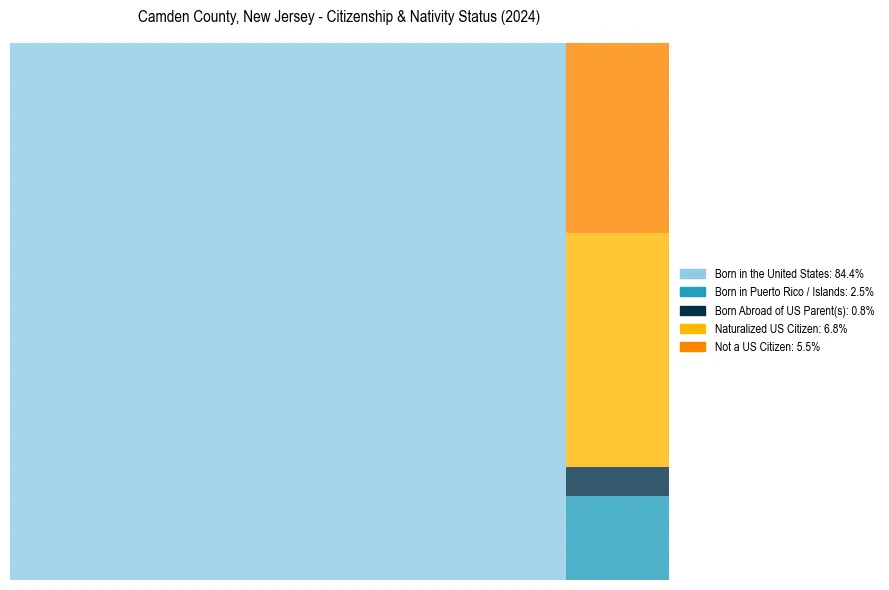
Camden County, New Jersey Nativity & Citizenship Distribution
Camden County, New Jersey Historical Nativity Trends (2010–2024)
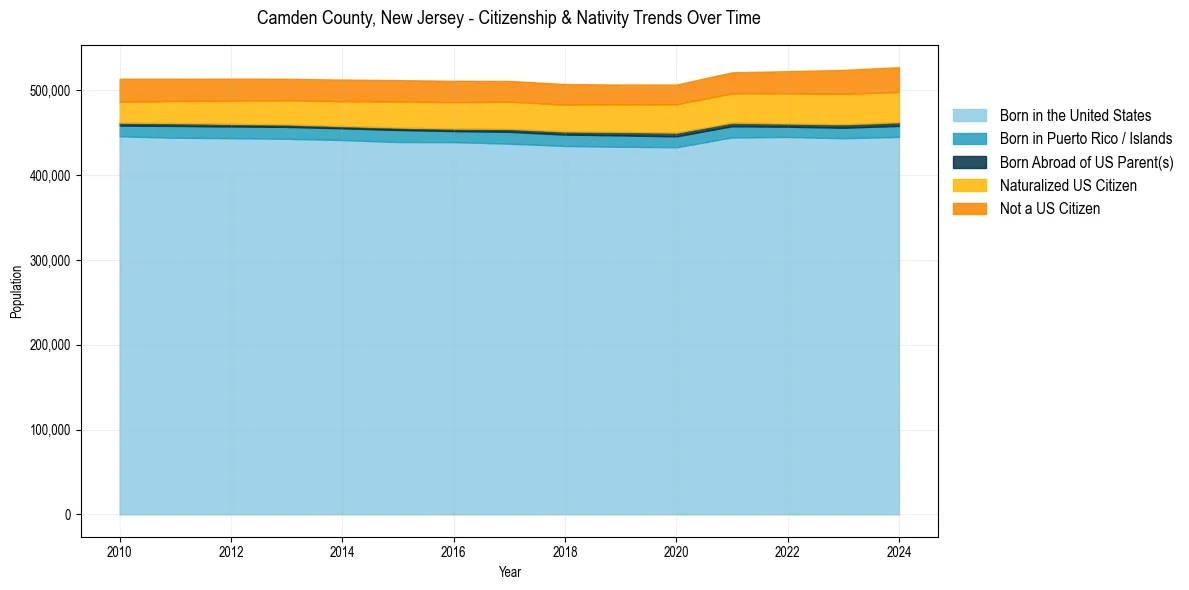
Camden County, New Jersey Population & Nativity History
| Year | Total Pop | Foreign Born | Native Born |
|---|---|---|---|
| 2024 | 527,257 | 12.3% | 87.7% |
| 2023 | 524,042 | 12.2% | 87.8% |
| 2022 | 522,581 | 11.8% | 88.2% |
| 2021 | 521,194 | 11.4% | 88.6% |
| 2020 | 506,721 | 11.2% | 88.8% |
| 2019 | 506,738 | 11.0% | 89.0% |
| 2018 | 507,367 | 11.0% | 89.0% |
| 2017 | 510,996 | 11.1% | 88.9% |
| 2016 | 511,145 | 11.0% | 89.0% |
| 2015 | 511,998 | 10.9% | 89.1% |
| 2014 | 512,632 | 10.7% | 89.3% |
| 2013 | 513,512 | 10.5% | 89.5% |
| 2012 | 513,660 | 10.4% | 89.6% |
| 2011 | 513,582 | 10.2% | 89.8% |
| 2010 | 513,574 | 10.1% | 89.9% |
Nativity & Citizenship FAQs for Camden County, New Jersey
Approximately 12.3% of residents in Camden County, New Jersey were born outside the United States.
The vast majority of residents, roughly 94.5%, are U.S. citizens (including both native-born and naturalized citizens).