Burlington County, New Jersey Nativity & Citizenship Status (2024)
Place of birth and citizenship status analysis for Burlington County, New Jersey
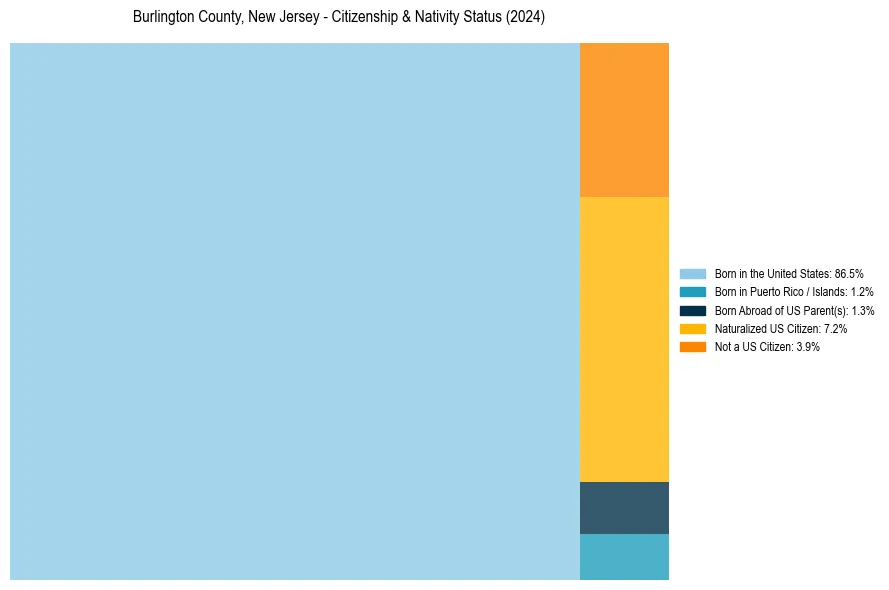
Burlington County, New Jersey Nativity & Citizenship Indicators (2024)
Native Born
89.0%
Foreign Born
11.0%
Naturalized
7.2%
US Citizens
96.1%
Burlington County, New Jersey Nativity & Citizenship Distribution
Burlington County, New Jersey Historical Nativity Trends (2010–2024)
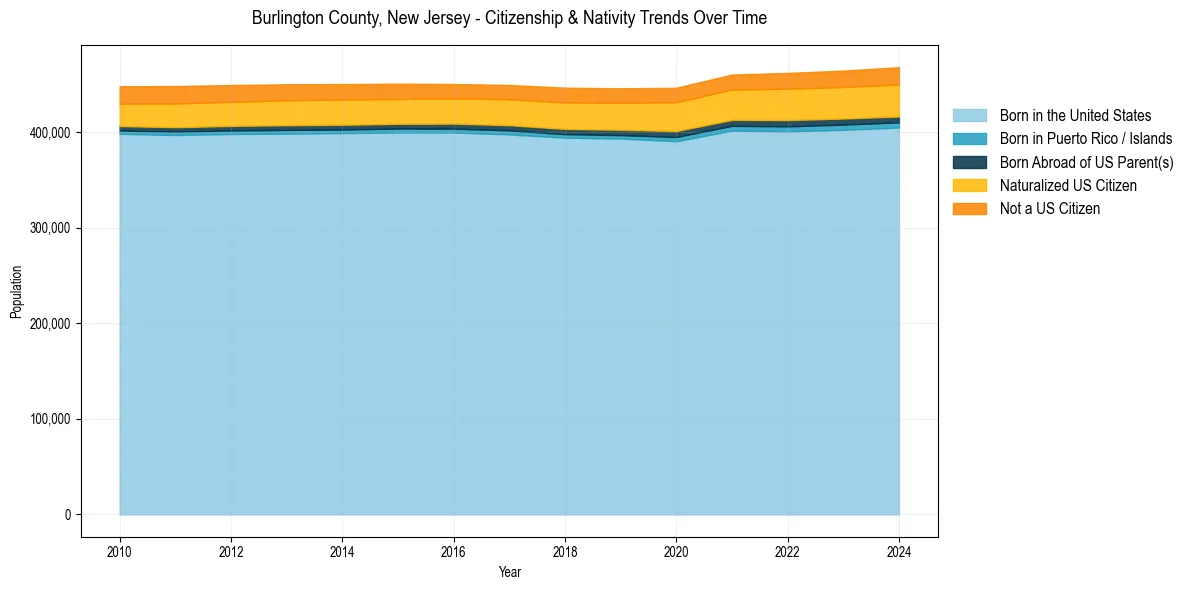
Burlington County, New Jersey Population & Nativity History
| Year | Total Pop | Foreign Born | Native Born |
|---|---|---|---|
| 2024 | 467,805 | 11.0% | 89.0% |
| 2023 | 464,226 | 10.8% | 89.2% |
| 2022 | 461,853 | 10.7% | 89.3% |
| 2021 | 460,102 | 10.3% | 89.7% |
| 2020 | 446,301 | 10.2% | 89.8% |
| 2019 | 445,702 | 9.7% | 90.3% |
| 2018 | 446,367 | 9.7% | 90.3% |
| 2017 | 449,192 | 9.4% | 90.6% |
| 2016 | 450,236 | 9.2% | 90.8% |
| 2015 | 450,556 | 9.3% | 90.7% |
| 2014 | 450,155 | 9.5% | 90.5% |
| 2013 | 449,964 | 9.5% | 90.5% |
| 2012 | 449,117 | 9.5% | 90.5% |
| 2011 | 448,095 | 9.6% | 90.4% |
| 2010 | 447,861 | 9.3% | 90.7% |
Nativity & Citizenship FAQs for Burlington County, New Jersey
Approximately 11.0% of residents in Burlington County, New Jersey were born outside the United States.
The vast majority of residents, roughly 96.1%, are U.S. citizens (including both native-born and naturalized citizens).