Bergen County, New Jersey Nativity & Citizenship Status (2024)
Place of birth and citizenship status analysis for Bergen County, New Jersey
Bergen County, New Jersey Nativity & Citizenship Indicators (2024)
Native Born
68.2%
Foreign Born
31.8%
Naturalized
21.1%
US Citizens
89.3%
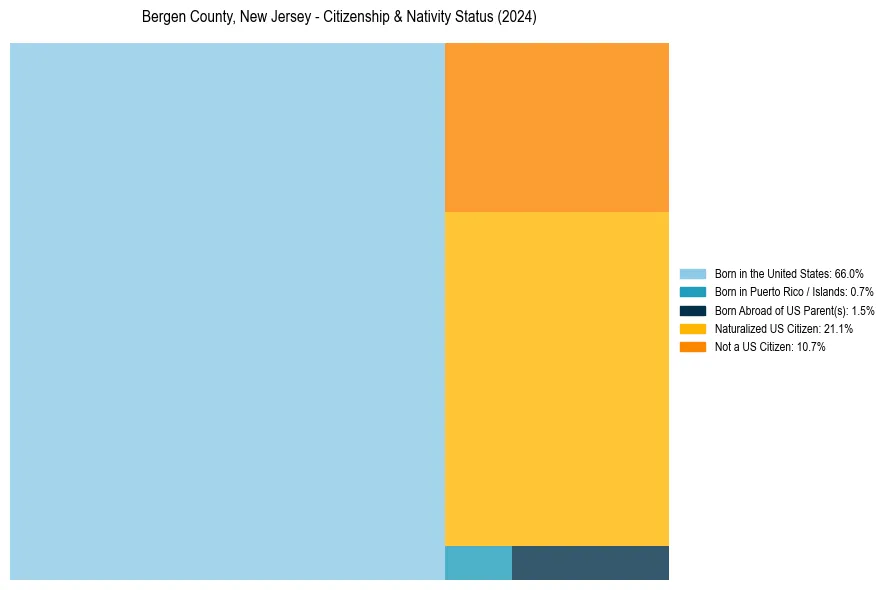
Bergen County, New Jersey Nativity & Citizenship Distribution
Bergen County, New Jersey Historical Nativity Trends (2010–2024)
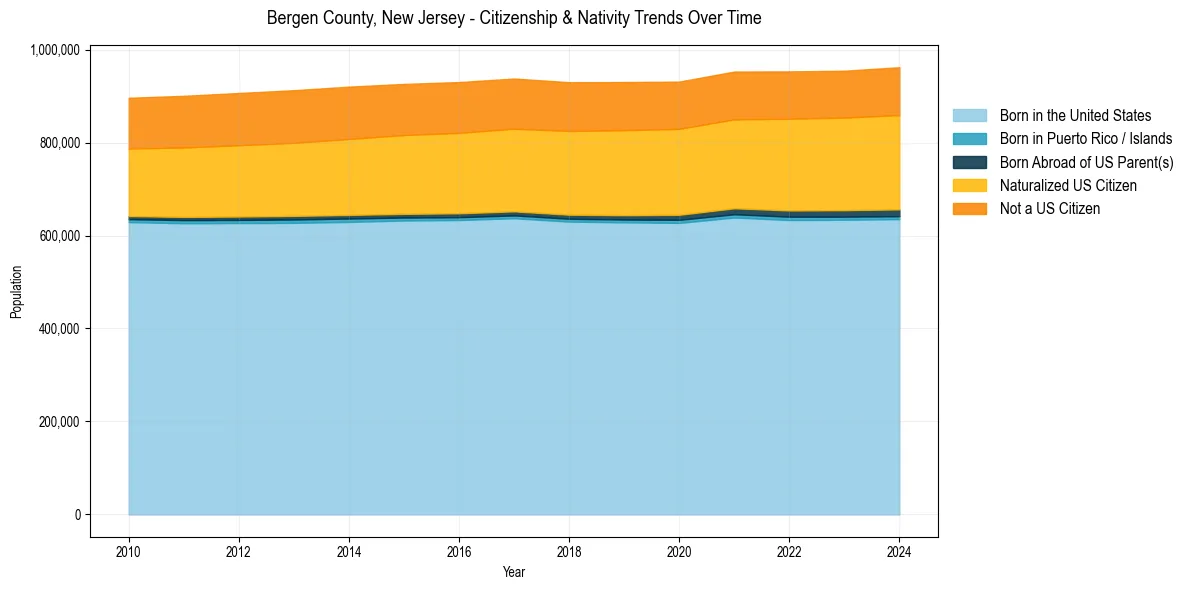
Bergen County, New Jersey Population & Nativity History
| Year | Total Pop | Foreign Born | Native Born |
|---|---|---|---|
| 2024 | 962,316 | 31.8% | 68.2% |
| 2023 | 954,717 | 31.4% | 68.6% |
| 2022 | 953,243 | 31.4% | 68.6% |
| 2021 | 952,979 | 30.9% | 69.1% |
| 2020 | 931,275 | 30.8% | 69.2% |
| 2019 | 930,390 | 30.8% | 69.2% |
| 2018 | 929,999 | 30.7% | 69.3% |
| 2017 | 937,920 | 30.5% | 69.5% |
| 2016 | 930,310 | 30.4% | 69.6% |
| 2015 | 926,330 | 30.2% | 69.8% |
| 2014 | 920,456 | 30.0% | 70.0% |
| 2013 | 912,795 | 29.6% | 70.4% |
| 2012 | 906,781 | 29.3% | 70.7% |
| 2011 | 900,730 | 28.9% | 71.1% |
| 2010 | 896,482 | 28.4% | 71.6% |
Nativity & Citizenship FAQs for Bergen County, New Jersey
Approximately 31.8% of residents in Bergen County, New Jersey were born outside the United States.
The vast majority of residents, roughly 89.3%, are U.S. citizens (including both native-born and naturalized citizens).